
This indicator aims to summarize the state of the Bitcoin cycle as efficiently as possible. It allows you to accurately identify the tops and bottoms of Bitcoin cycles, as well as the bullish and bearish phases of the market. Based primarily on technical analysis, this indicator also takes into account several on-chain metrics.
Usage advice #
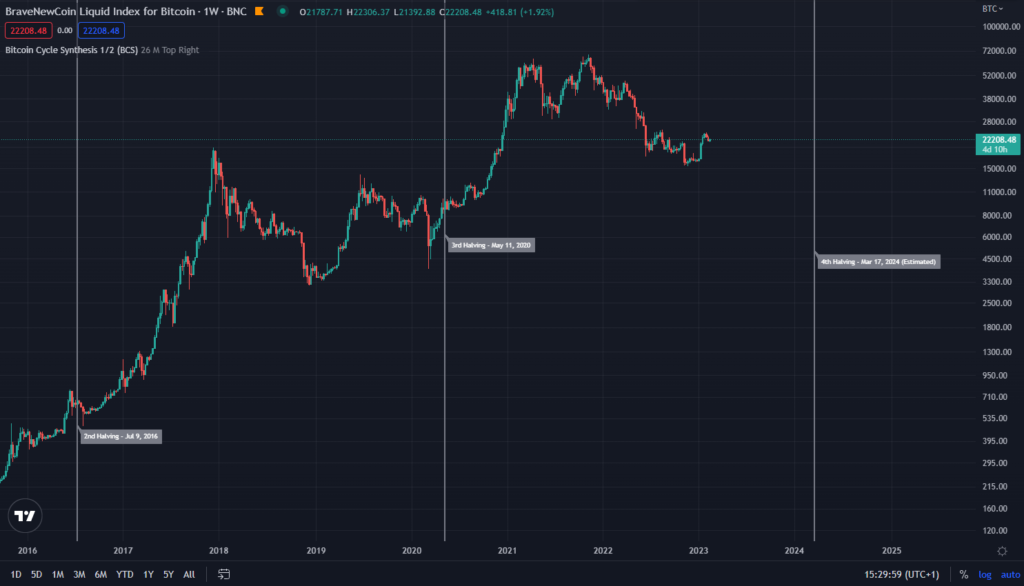
It is recommended to use this indicator with BLX (BraveNewCoin Liquid Index for Bitcoin), to get the best history. The indicator display is optimized for a weekly or monthly period, but it works globally with all timeframes. Use your graph in logarithmic mode.
The different elements and signals – On the price chart #
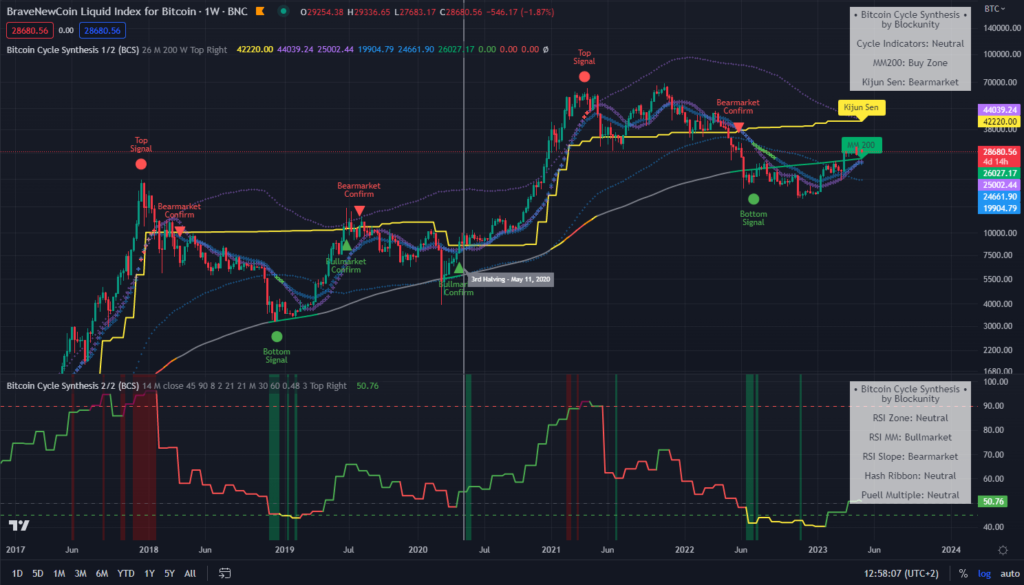
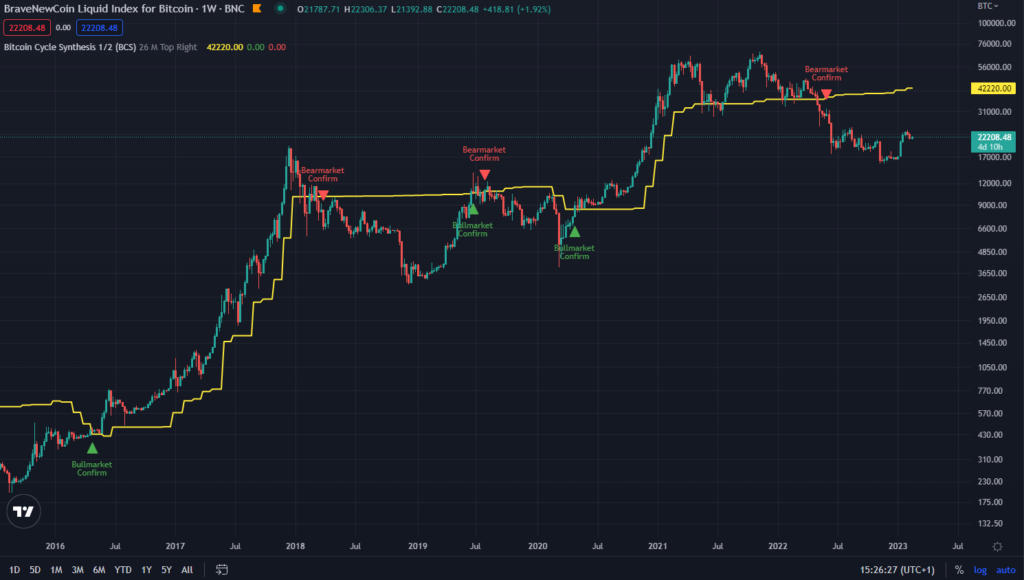
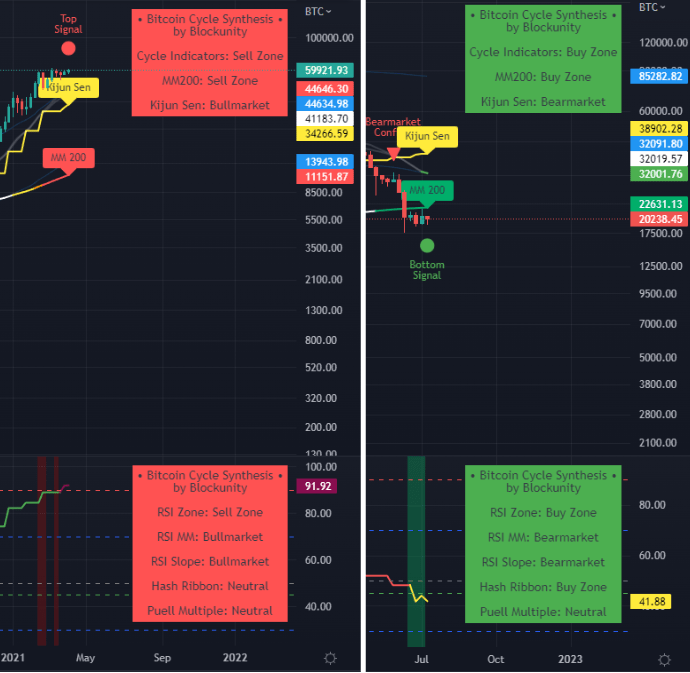
- The monthly Kijun Sen (in yellow) has historically been used to identify confirmation of a bull or bear market. When the Bitcoin price closes monthly below this line, it usually indicates an entry into the bearmarket. Conversely, closing monthly above this line is a bull market signal. This line is one of the most important lines in the “Ichimoku Kinko Hyo” system. By default it represents the average price of the last 26 periods.
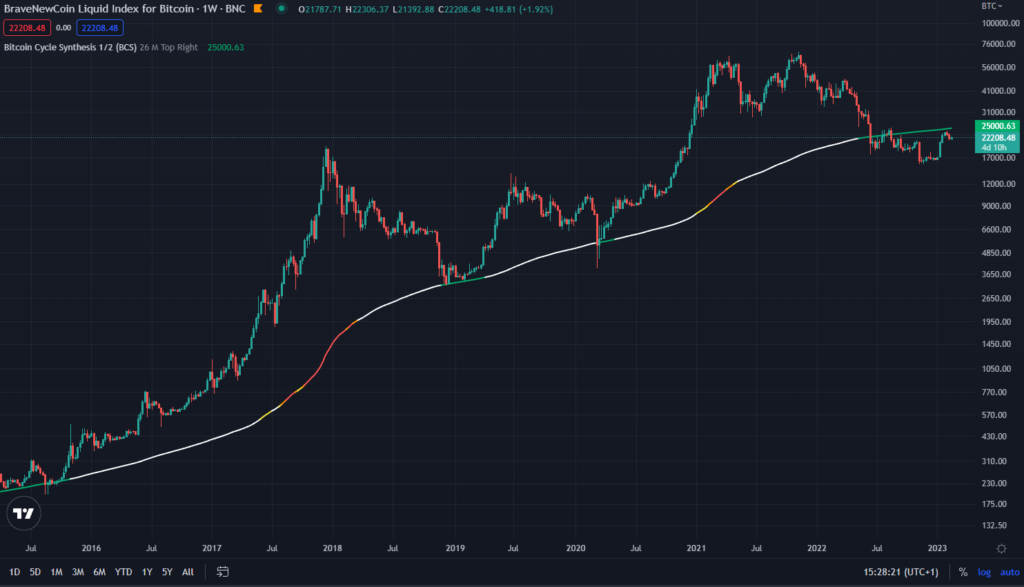
- The moving average of the last 200 weekly periods (MM 200) has in the past provided valuable insight into Bitcoin’s bottom areas. We vary its color from green to red depending on how far the price deviates from this average. A green color indicates a buying zone, while a red color indicates a selling zone. Yellow and orange colors indicate cautionary and overheating zones.
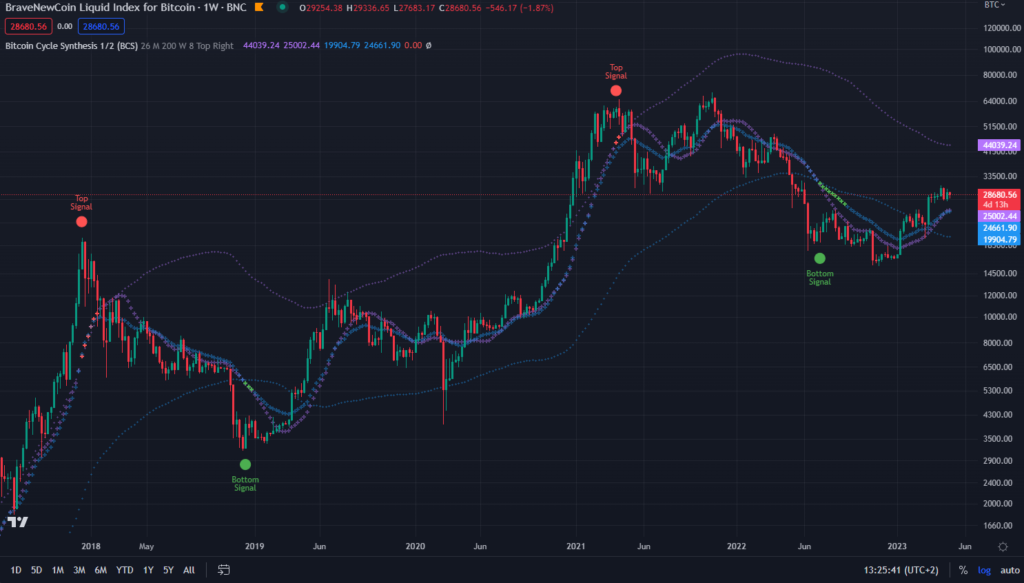
- We can also see a channel represented by two blue faded lines. Beware, it does not show supports or resistances. It is accompanied by two signal lines which are grey by default. All these lines are adjusted moving averages. When the signal lines cross their respective channel line, it sends a market high or low signal. The signal lines then turn red or green to indicate sell and buy zones.
- You can find the dates of previous Bitcoin halvings, as well as an estimate of the next date of this event. This happens every 210,000 blocks (about every 4 years), and halves the BTC reward for mining each block. The main objective is to keep inflation under control by reducing the amount of Bitcoins created over time, thus affecting the price of Bitcoin in the long term.
The different elements and signals – In the oscillator #
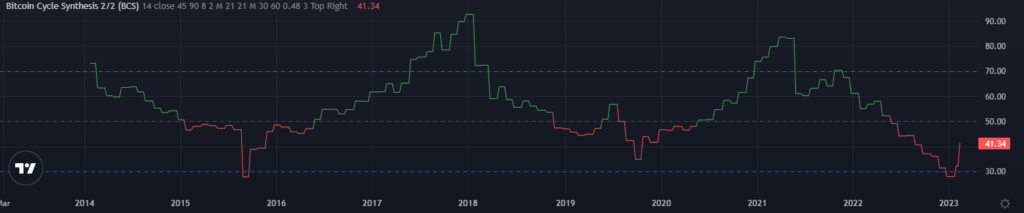
- The main element is an RSI (Relative Strength Index) in monthly period. It allows to give selling zones when it exceeds the value 90 (dark pink color), as well as buying zones when it goes under the value 45 (yellow color). Its color also varies between green and red according to a moving average, which allows to define if we are in bearmarket (red) or bullmarket (green).
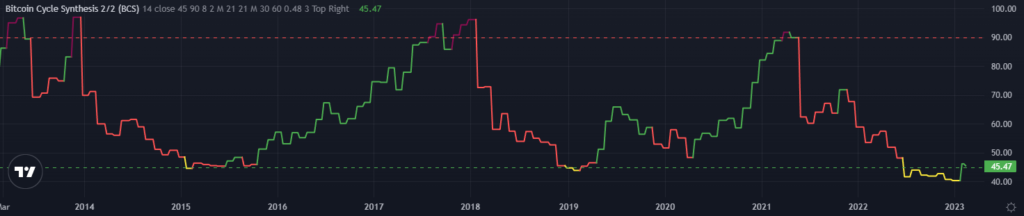
- It is possible to display an RSI Slope. This indicator is a modified RSI that takes into account the volatility of the asset. It also allows to define if we are in bearmarket (red) or bullmarket (green).
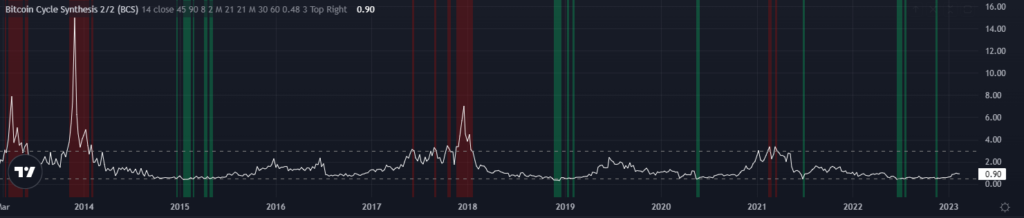
- The Hash Ribbon is not displayed, but taken into account in the information panel. This indicator gives a moving average of the bitcoin hash rate and the difficulty of extraction. This allows you to define buying zones based on data from Bitcoin mining.
- The Puell Multiple examines the profitability of miners to provide a fundamental perspective on the price of Bitcoin. By default, we set it to send a buy signal when its value falls below 0.48, and a sell signal when its value exceeds 3. These signals are represented by green and red backgrounds in the oscillator.
Settings #
By opening the parameters of the indicator, it is possible to :
- Change the periods taken into account in the calculation of the Kijun Sen, as well as its time unit.
- Display or not the labels of certain lines and halving dates.
- Customize all the parameters of the RSI, as well as the possibility to display Bollinger Bands on it.
- Customize the RSI Slope parameters and display it.
- Change the periods of the Hash Ribbon moving averages.
- Change the buy and sell zones of the Puell Multiple.
- Choose the position of the information panel.
Panel information #
The two panels give the following information:
- Cycle Indicator: Sell Zone / Neutral / Buy Zone.
- MM200: Sell Zone / Neutral / Buy Zone.
- Kijun Sen: Bearmarket / Neutral / Bullmarket.
- RSI Zone: Sell Zone / Neutral / Buy Zone.
- RSI MM: Bearmarket / Neutral / Bullmarket.
- RSI Slope: Bearmarket / Neutral / Bullmarket.
- Hash Ribbon: Buy Zone / Neutral.
- Puell Multiple: Sell Zone / Neutral / Buy Zone.
The color of the panels varies between green and red depending on the correlation of the different signals.
Indicator link #
Part 1 (price curve information): https://www.tradingview.com/script/ESyX6u1G-Bitcoin-Cycle-Synthesis-1-2-BCS/
Part 2 (the oscillator): https://www.tradingview.com/script/4gThgr7r-Bitcoin-Cycle-Synthesis-2-2-BCS/
Please click on the Boost button of our indicators!
And don’t forget to follow us on TradingView so you don’t miss any updates: https://www.tradingview.com/u/Blockunity/