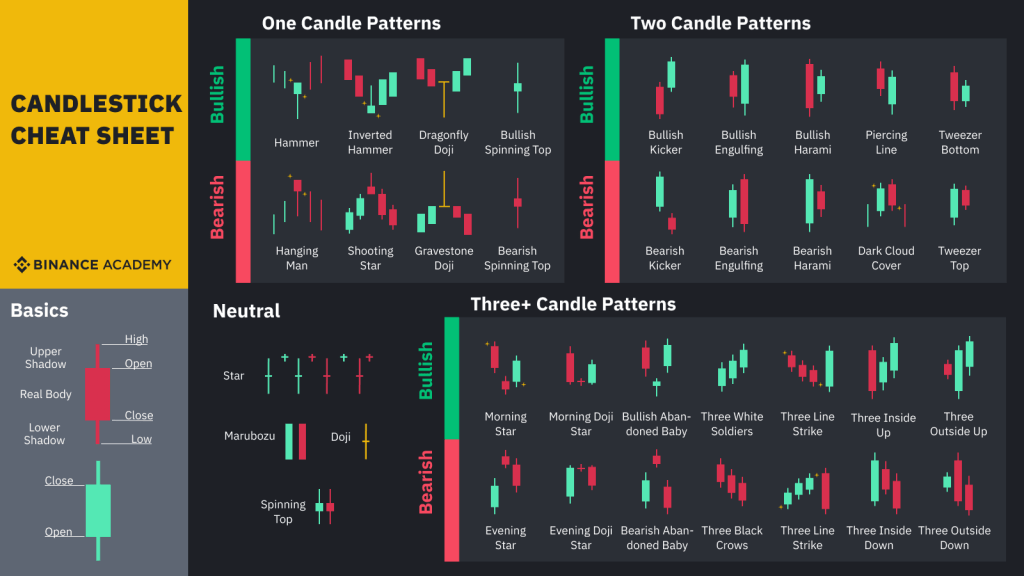
Japanese candlesticks are the most used price indication format in trading. They are used in the technical analysis of an asset to represent the variations in price and can give indications on the potential direction of the price. They are composed of a body and wicks.
By default, a green candle indicates a rising price. Contrary, a red candle means a falling price. This display format is the most complete because one candle gives 4 information:
- the opening price
- the highest
- the lowes
- the closing price
There are different types of japanese candlestick figures, the most common are:
- Marubozu: indicates a frank impulse.
- Big body.
- No or very small wicks.
- Bullish or bearish.
- Doji: sign of hesitation.
- No body.
- Long wicks.
- Spinning Top: sign of hesitation.
- Almost no body.
- Long wicks.
- Hammer: sign of bullish impulse.
- Small bullish body.
- Long downtrend wick, without uptrend wick.
- Can also be compared to a rocket.
- Shooting Star: sign of bearish impulse.
- Small bearish body.
- Long uptrend wick, without a downtrend wick.
The sequence of those types of figures form patterns indicating bearish or bullish signals, regrouped on the following document.