

Diamond Bottom #
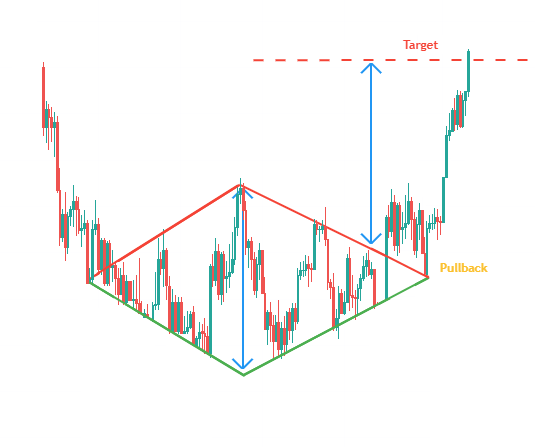
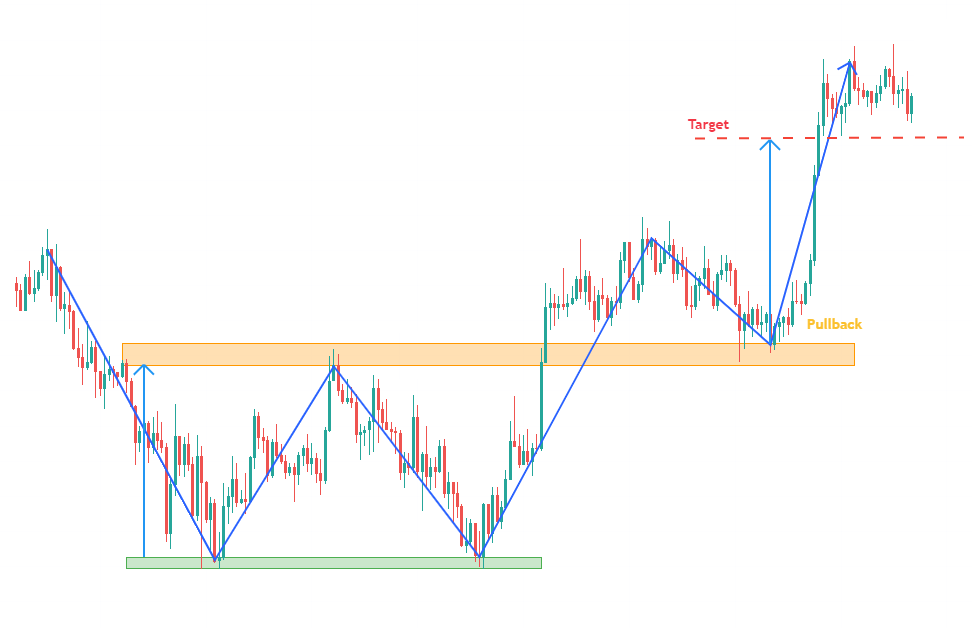
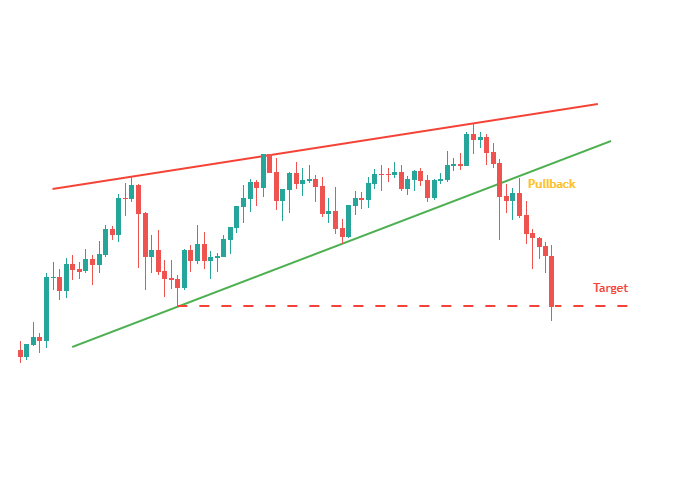
The Diamond Bottom is a trend reversal chart pattern. It is formed by two symmetrical juxtaposed triangles, thus forming a diamond.
A Diamond Bottom should be preceded by a downtrend. This figure marks the shortening of the current seller and the indecision of investors.
The price target of a Diamond Bottom is calculated by reporting the maximum height of the diamond at the exit point.
In general, the exit movement is as fast as the downward movement that preceded it.
Notes and Statistics: #
- Top diamonds appear 3 times more often than bottom diamonds.
- Occasionally, the price forms an inverted head and shoulders within the diamond bottom pattern.
- The diamonds pattern are very difficult to spot, and often forgotten by traders.
- In 82% of cases, there is a bullish exit.
- In 79% of cases, the objective of the figure is achieved.
- In 43% of cases, a pullback occurs on the support.
V Bottom #
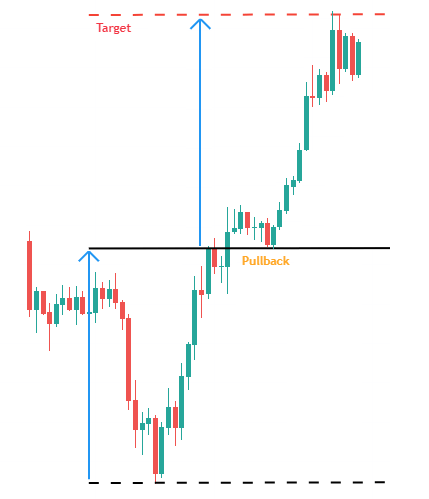
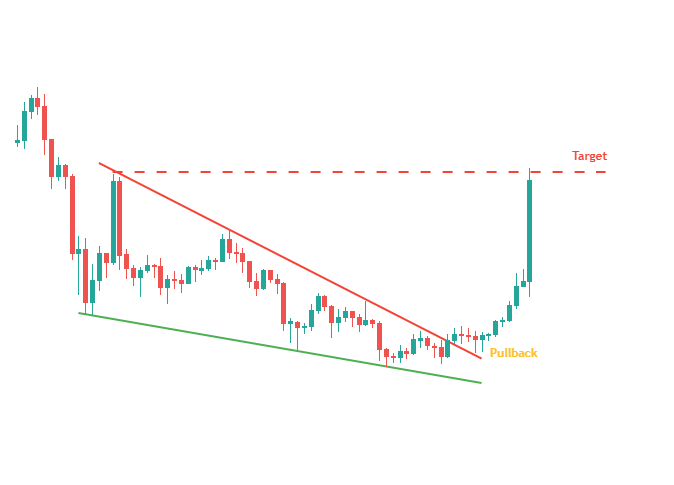
The V-shaped figure shows a sharp movement of the price, then a full retracement of the movement in stride.
The V Bottom often intervenes in a downtrend and announces a trend reversal. However, it can also form in an uptrend.
The V appears regularly following an economic announcement that upsets investors. This is a sign of high volatility.
The theoretical objective of the figure is the distance between the neck line and the lower/upper V which is transferred to the neck line.
V Top #
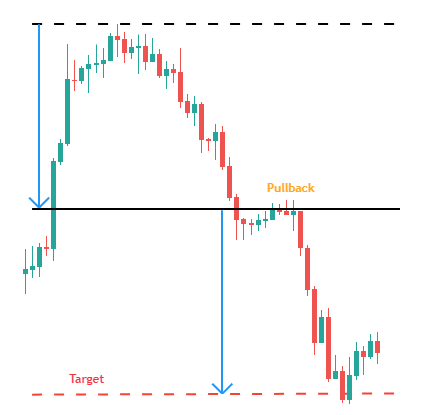
The V-shaped figure shows a sharp movement of the price, then a full retracement of the movement in stride.
The V top often intervenes in an uptrend and announces a trend reversal. However, it can also form in a downtrend.
The V appears regularly following an economic announcement that upsets investors. This is a sign of high volatility.
The theoretical objective of the figure is the distance between the neck line and the lower/upper V which is transferred to the neck line.
Double Top #
The Double Top is a bearish chart pattern in the shape of an “M”. The price makes two successive peaks at approximately the same level, indicating significant resistance. This chart pattern shows investors’ desire not to let the price reach new highs, and their desire to reverse the current trend.
The objective of a double top figure is calculated by plotting the height of the figure below the neck line.
When validating these patterns, it is common for the course to pullback on the neck line before reaching the objective of the figure.
Notes and Statistics: #
- In 75% of the cases, the movement is bearish after a double top.
- In 83% of the cases, the course breaks the neck line of the double top figure.
- In 71% of the cases, the goal of the double top figure is achieved when the neck line is broken.
- In 83% of the cases, the bearish movement continues at the break of the neck line of the double top pattern.
- In 61% of cases, after exiting, the price performs a resistance pullback on the neck line of the double top figure.
Double Bottom #
The Double Bottom is a bullish chart pattern in the shape of a “W”. The price successively makes two troughs (lower) at approximately the same level, indicating significant support. This chart pattern shows investor’s desire not to let the price reach new lows, and their desire to reverse the current trend.
The goal of a double bottom figure is calculated by plotting the height of the figure above the neck line.
When validating these patterns, it is common for the course to pullback on the neck line before reaching the objective of the figure.
Notes and Statistics: #
- In 70% of the cases, the movement is bullish after a double bottom.
- In 67% of the cases, the goal of the double bottom figure is achieved when the neck line is broken.
- In 97% of the cases, the bullish movement continues at the break of the neck line of the double bottom figure.
- In 59% of the cases, after exit, the price performs a support pullback on the neck line of the figure in Double Bottom.
Pennant #
This continuation chartist figure looks a lot like the symmetrical triangle but its characteristics are different.
This chartist figure generally appears following a sudden upward or downward movement. The lifespan of a flag is short depending on the timeframe.
The direction of exit of a pennant figure depends on the movement which preceded it. The formation of the flag can therefore occur in an upward or downward trend.
The target price of a flag is calculated in relation to the trend that preceded its formation. Usually traders report the full height of the move leading up to the formation of the flag to the last low/high point in the pattern.
Notes and Statistics: #
- In 75% of the cases, the pennant is released in the same direction as the movement preceding its formation.
- In 55% of the cases, the price target for the pennant figure is achieved.
- In 16% of the cases, the price pulls back on the pennant after leaving.
Diamond Top #
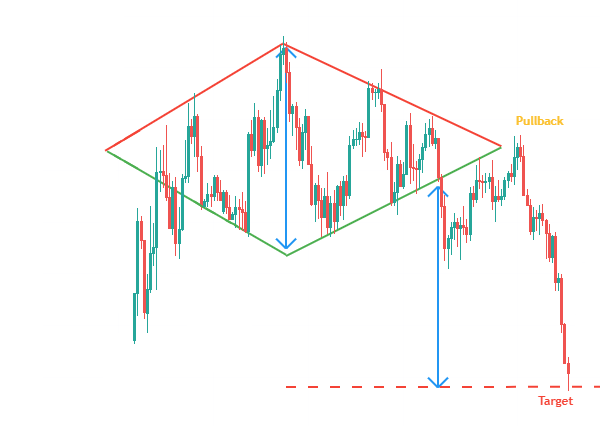
The Diamond Top is a trend reversal chart pattern. It is formed by two symmetrical juxtaposed triangles, thus forming a diamond.
A Diamond Top must be preceded by an uptrend. This figure marks the weakening of the buying trend and the indecision of investors. Volatility and swings are increasing in the first half of the pattern, then decreasing in the second half of the pattern.
The price target of a Diamond Top is calculated by reporting the minimum height of the diamond at the exit point.
In general, the exit movement is as fast as the upward movement that preceded it.
Notes and Statistics: #
- Top diamonds appear 3 times more often than bottom diamonds.
- Occasionally, the price forms an head and shoulders within the diamond top pattern.
- The diamonds pattern are very difficult to spot, and often forgotten by traders.
- In 80% of cases, there is a bearish exit.
- In 95% of cases, the objective of the pattern is reached.
- In 59% of cases, a pullback occurs on the support.
Inverted Head & Shoulders #
Inverted head and shoulders are trend reversal chart patterns. In theory, the height of both shoulders should be the same, and the neck line should be horizontal. In practice, it often happens that the shoulders are not the same height, or that the neck line is ascending or descending (depending on the shape of the shoulders of the figure).
The first and third trough (approximately the same height) form the shoulders.
The second trough (at a height lower than that of the shoulders) forms the head.
There is no fixed rule but some authors consider that the height of the head should be 1.5 to 2 times that of the shoulders.
The neck line is determined by the two highest lows reached after the first shoulder and the head. These two low points are not always at the same level. The neck line can therefore be ascending, descending or more rarely, horizontal.
The inverted head and shoulders figure is definitively validated at the break of the neck line. The target price is equal to the height between the neck line and the top of the head, carried under the neck line.
Notes And Statistics: #
- In 98% of the cases, the output of the inverted head and shoulders pattern is bullish.
- In 74% of the cases, the price achieves the goal of the inverted head and shoulders pattern when the neck line is broken.
- In 97% of the cases, the bullish movement continues at the break of the neck line.
- In 52% of the cases, after exit, the course performs a support pullback on the neck line of the reversed head and shoulders pattern.
Rising Wedge #
The rising wedge is a bearish chart pattern (known as a “reversal pattern”). It is formed by two converging bullish lines.
This is confirmed / valid if it has good oscillation between the two ascending lines. The upper line is resistance line and the lower line is support line.
The ascending wedge is considered valid if the price touches at least 3 times the support line and 2 times the resistance line (or at least 2 times the support line and 3 times the resistance line).
An ascending wedge marks the breathlessness of buyers. The convergence of the two lines in the same direction (decrease in the amplitude of the prices) informs us that the prices continue to increase with movements of amplitude less and less high. Buyers are finding it increasingly difficult to bounce price back on support. The lowest reached during the first correction on the support of the rising wedge will form the support. A second wave of increases will then occur, but of lesser amplitude, signaling the weakness of buyers. A third wave is formed thereafter but the prices will increase less and less on contact with the support. Volumes are then at their lowest and decrease with the waves. The movement then has almost no buying force which induces the desire for a bearish reversal.
The break of the support line definitively validates the figure. This break is generally accompanied by high volumes. The price target is determined by the lowest point that caused the wedge to form.
Notes and Statistics: #
- The steeper the trend lines of the rising wedge (strongly ascending), the more violent the downward movement will be at the breakout.
- False breaks give an indication when in the direction of exit. In only 3% of cases, if a false bearish breakout occurs, the exit will be from the top. Exploiting a false bearish breakout is therefore statistically low risk.
- The retracement is generally 2 times faster than the time of formation of the rising wedge.
- Pullbacks are detrimental to the performance of the figure.
- The break point generally occurs at 60% of the length of the rising wedge.
- Very wide rising wedge give better performance than narrow ones.
- 82% of cases, the exit is bearish.
- 55% of cases, this is a reversal figure.
- 63% of cases, the goal of the figure is achieved when the support line is broken.
- 53% of cases, the price carries out a pullback in resistance on the support line.
- 27% of cases, false breaks appear.
Falling Wedge #
The falling wedge is a bullish chart pattern (called “reversal“). It is formed by two converging bearish lines.
This is confirmed / valid if it has good oscillation between the two descending lines. The upper line is resistance line and the lower line is support line.
The falling wedge is considered valid if the price touches at least 3 times the support line and 2 times the resistance line (or at least 2 times the support line and 3 times the resistance line).
A falling wedge marks the sellers’ breathlessness. The convergence of the two lines in the same direction (decrease in the amplitude of the prices) informs us that the prices continue to fall with movements of amplitude less and less low. Sellers are finding it increasingly difficult to push price below resistance. The highest reached during the first correction on the resistance of the falling wedge will form the resistance. A second wave of decline will then occur, but of a lesser amplitude, signaling the weakness of sellers. A third wave is formed thereafter but prices will fall less and less on contact with resistance. Volumes are then at their lowest and decrease with the waves. The movement then has almost no selling force, which induces the desire for a bullish reversal.
The break of the resistance line definitively validates the pattern. This break is generally accompanied by high volumes. The price target is determined by the highest point that led to the formation of the wedge.
Notes and Statistics: #
- The steeper the trend lines of the falling wedge (strongly descending), the more violent the upward movement will be at the breakout.
- False breaks give an indication when in the direction of exit. In only 3% of cases, if a false bullish breakout occurs, the exit will be at the bottom. Exploiting a false bullish breakout is therefore statistically low risk.
- The retracement is generally 2 times faster than the formation time of the falling wedge.
- Pullbacks are detrimental to the performance of the figure.
- The break point generally occurs at 60% of the length of the falling wedge.
- Very wide falling wedge give better performance than narrow ones.
- 82% of cases, the exit is bullish.
- 55% of cases, this is a reversal figure.
- 63% of cases, the objective of the pattern is reached when the resistance line is broken.
- 53% of cases, the price performs a pullback in support on the resistance line.
- 27% of cases, false breaks appear.
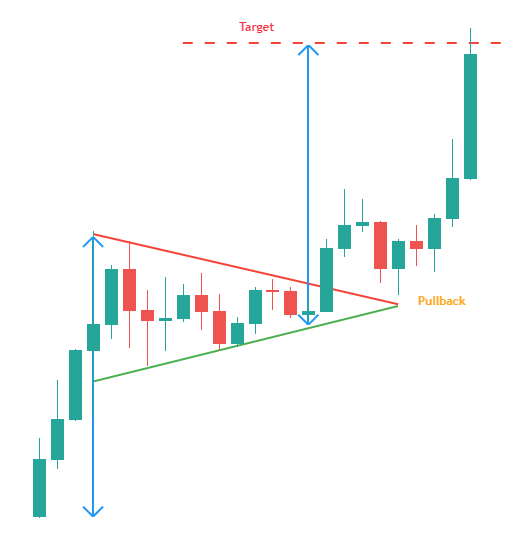
Symmetrical Triangle #
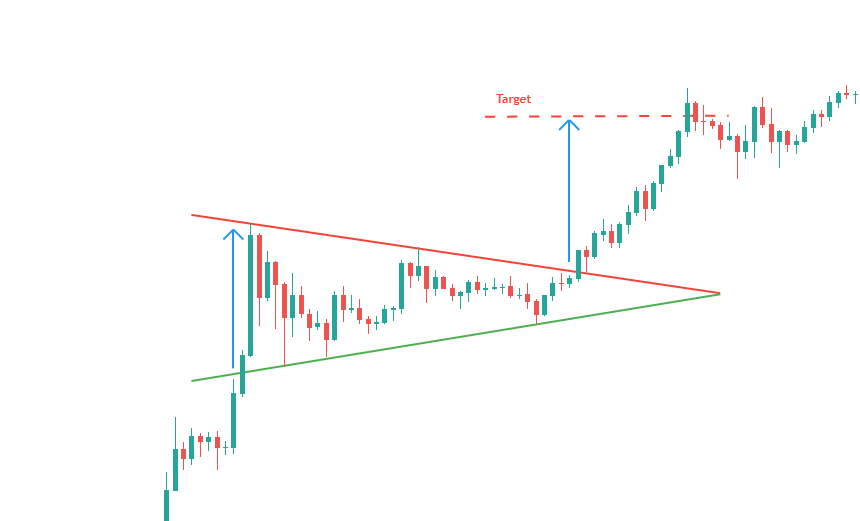
The symmetrical triangle is a continuation chartist figure.
It is formed by two converging trend lines that are symmetrical about the horizontal. The upper line is called “resistance”. The lower line is called “support”.
For the symmetrical triangle to be bullish, the movement preceding the formation of the triangle must be bullish. For the symmetrical triangle to be bearish, the movement preceding the formation of the triangle must be bearish.
The symmetrical triangle is valid if there is an oscillation between the two lines.
The symmetrical triangle pattern is considered valid if the price touches at least 3 times the support line and 2 times the resistance line.
The target price of a symmetrical triangle is determined by the height of the base of the triangle carried over to the break point. Another technique is to draw a line parallel to the triangle’s support / resistance line from the first contact with the resistance / support.
Notes and Statistics: #
- The exit is most often done at 2/3 of the triangle. This is the output level that offers the best performance.
- The target price of the ascending triangle is generally reached before the point of the triangle.
- Avoid taking a position if the break / exit occurs before 2/3 of the triangle.
- In 54% of cases, the exit is bearish.
- In 61% of cases, the descending triangle is a continuation figure.
- In 54% of cases, the price target of the triangle is reached when the support is broken down.
- In 64% of cases, after exiting, the price carries out a pullback in resistance on the support line of the triangle.
- More than half the time, when a false breakout occurs from the bottom, the exit is finally made from the top. On the other hand, false breakouts from above are rare with only 6%.
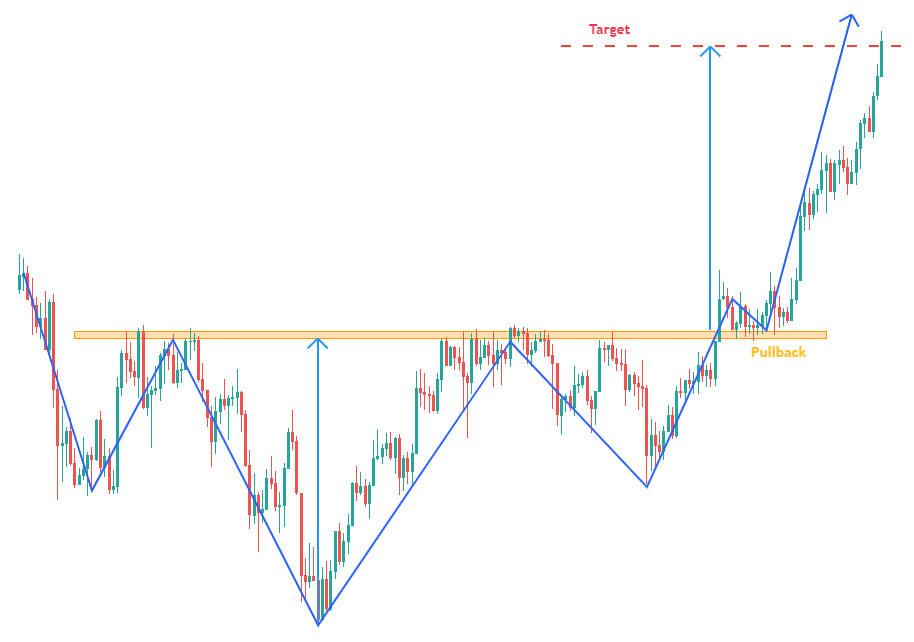
Horizontal Channel #
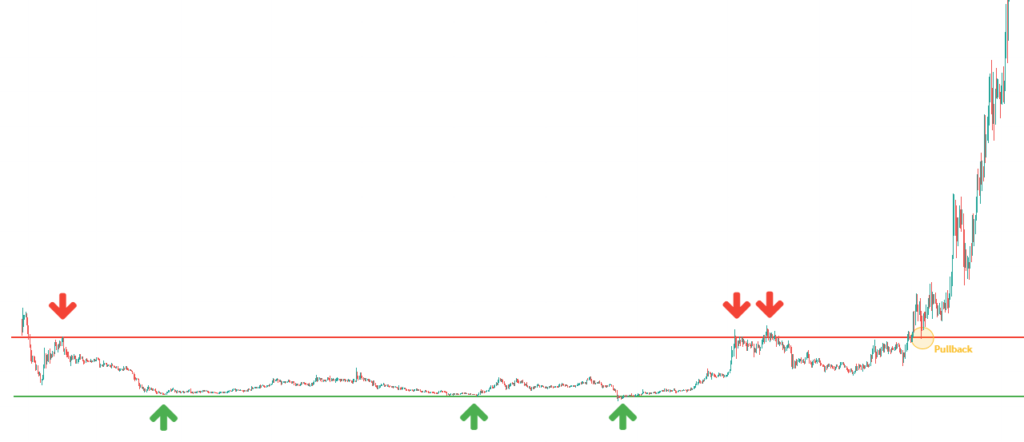
The horizontal channel is a neutral chart pattern that marks the indecision of investors. Buyers and sellers fight, and it is only when they leave the horizontal channel that they agree on a meaning. Either buyers pass sellers or sellers pass buyers. Hence the strong power of the movement at the exit of the horizontal channel.
The horizontal channel does not allow you to anticipate the orientation of the next movement. It is only when exiting a horizontal channel that investors are fixed (Bullish if exit from the top; Bearish if exit from the bottom).
The horizontal channel can be seen as a continuation figure.
The horizontal channel is formed by two parallel horizontal straight lines which frame the evolution of the price.
The upper line is called the “resistance line”. The lower line is called the “support line”.
The horizontal channel is a frequent chartist figure that can be found on all time units.
Notes and Statistics: #
- The longer the horizontal channel, the more powerful the output movement will be.
- The course frequently performs a pullback on the channel after exit.
- The exit is often made at the 4th point of contact after one of the lines of the horizontal channel.
Descending Triangle #
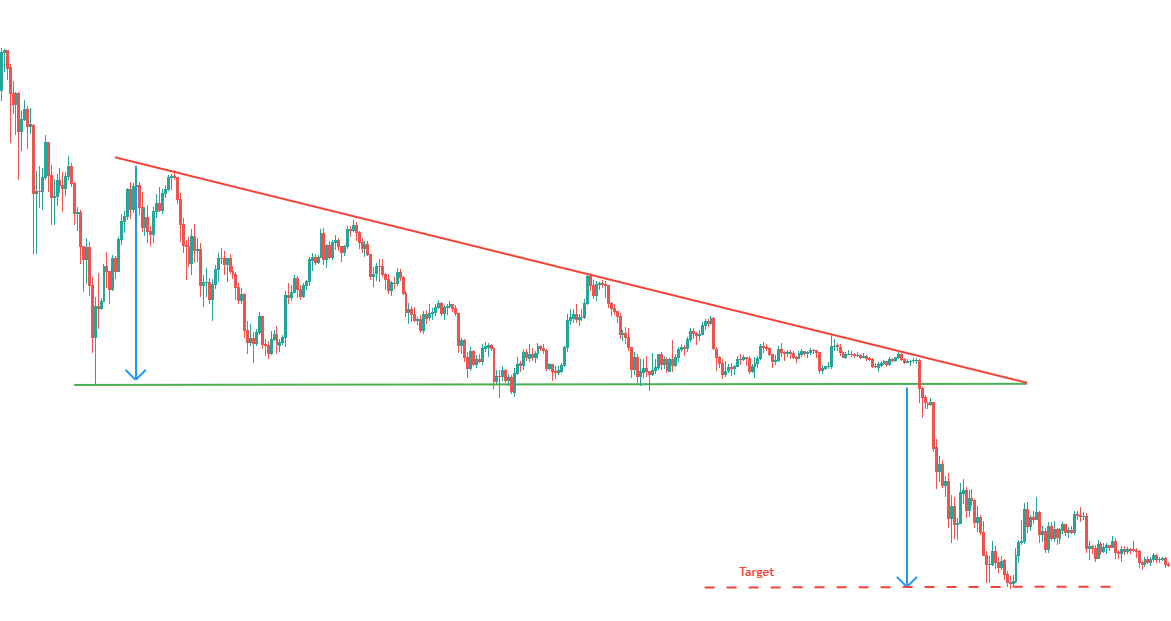
The descending triangle is a continuation bearish chart pattern. The figure is formed by two converging lines.
The first line is a bearish slant forming resistance, also called the “descending triangle resistance line”.
The second line is a horizontal support, also called a “descending triangle support line”.
The descending triangle is confirmed / valid if it has oscillation between the two lines.
The descending triangle is considered valid if the price touches at least 3 times the support line and 2 times the resistance line (or at least 2 times the support line and 3 times the resistance line).
The price objective of a descending triangle is determined by the height of the base of the triangle which is carried over to the breakout point. Another technique is to draw a parallel to the line of resistance of the descending triangle from the first contact with the support.
Notes and Statistics: #
- The exit is most often done at 2/3 of the triangle. This is the output level that offers the best performance.
- The target price of the ascending triangle is generally reached before the point of the triangle.
- Avoid taking a position if the break / exit occurs before 2/3 of the triangle.
- In 54% of cases, the exit is bearish.
- In 61% of cases, the descending triangle is a continuation figure.
- In 54% of cases, the price target of the triangle is reached when the support is broken down.
- In 64% of cases, after exiting, the price carries out a pullback in resistance on the support line of the triangle.
- More than half the time, when a false breakout occurs from the bottom, the exit is finally made from the top. On the other hand, false breakouts from above are rare with only 6%.
Descending Flag #
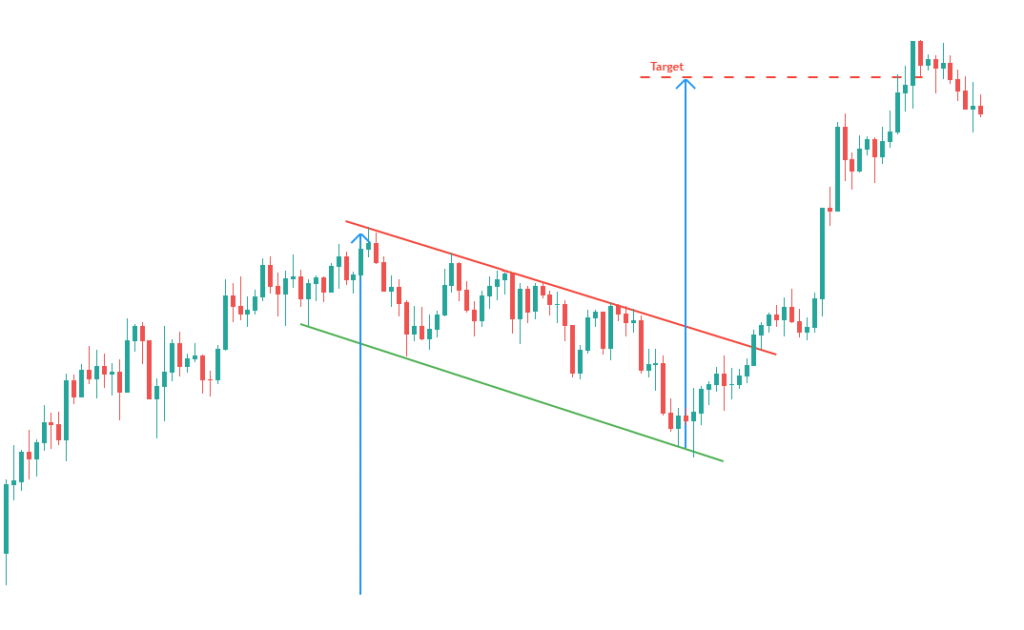
The descending flag (bull flag) is a continuation figure. The flag is formed by two parallel bearish lines which form a rectangle. It is therefore oriented in the opposite direction of the trend that it consolidates. Unlike a bearish channel, this pattern is very short term and signals the need for buyers to pause.
The formation of the descending flag occurs in an uptrend. Most often, this pause occurs halfway through the movement.
The calculation of the target is done relative to the initial trend. We calculate the height of the entire upward movement preceding the formation of the descending flag and then we report this height to the last low point of the figure.
Notes and Statistics: #
- The more powerful the movement preceding the formation of the flag, the more powerful the movement following the bullish exit.
- The performance of a flag is much less important when it is oriented in the direction of the trend.
- A flag with narrow lines is more efficient than a flag with wide bands.
- A flag is more powerful if there are no false breaks.
- Pullbacks are bad for the performance of this figure.
- In 87% of cases, there is a bullish exit.
- In 62% of cases, the objective of the figure is achieved.
- In 10% of cases, a pullback occurs on the resistance.
- 76% of descending flags occur in the upper 1/3 of the annual range.
Cup and Handle #
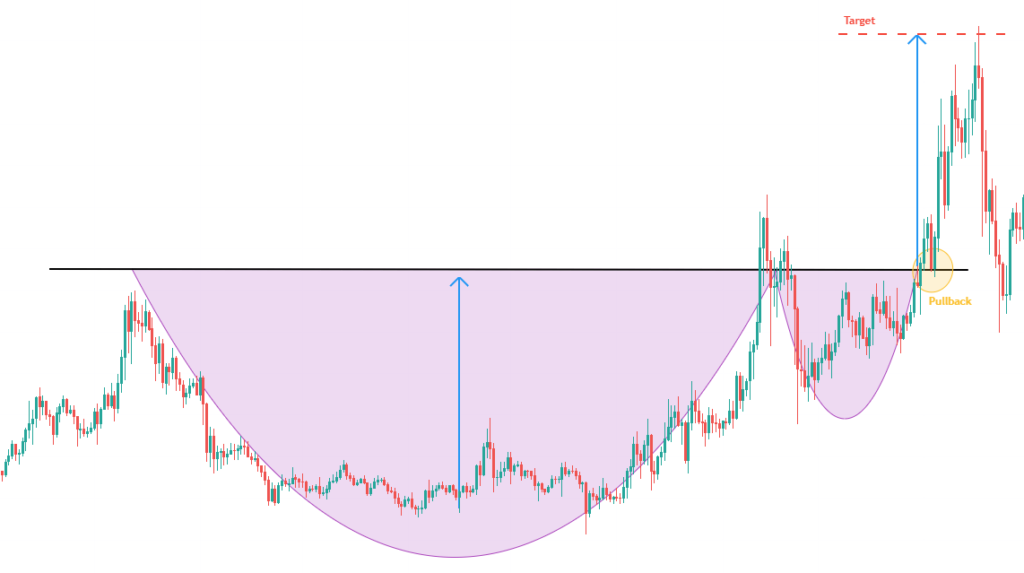
The chartist figure in cup and handle is a continuation figure formed by two rounded hollows, the first being deeper and wider than the second.
The tops of the cup and the handle are aligned on the same horizontal resistance line. This line is called the neck line.
For the figure to be valid, several rules must be respected:
- The cup figure with handle must be preceded by a significant upward movement.
- The low of the trough of the cup must be less than 50% of the upward movement preceding the formation of the pattern.
- The lowest of the hollow of the handle must be less than 50% of the height of the cup.
The shape of the two troughs can make one think of a rounding bottom, which reflects the progressive exhaustion of sellers. Buyers gradually regain control once the neckline is crossed (psychological threshold), the buying force then becomes very strong.
The objective of the figure in cup with handle is calculated by deferring the height of the cup to the point of breakage of the handle. However, it is more advisable to postpone only half the height of the cup according to the studies of T. Bulkowki.
Notes and Statistics: #
- If the cup has a lower left side than the right side (upward neck line), the performance of the figure is more important.
- It is advisable to wait for a pullback in support on the neck line before considering opening a Long position (when buying) after the formation of a cup figure with handle.
- In 79% of cases, the output of a cup and handle is bullish.
- In 73% of cases, the objective of the cup figure with handle is reached (half the height of the cup), after breaking the neck line.
- In 74% of cases, after exit, the price carries out a pullback in support on the neck line. price shows false line breaks, or false triangle exits.
Ascending Triangle #
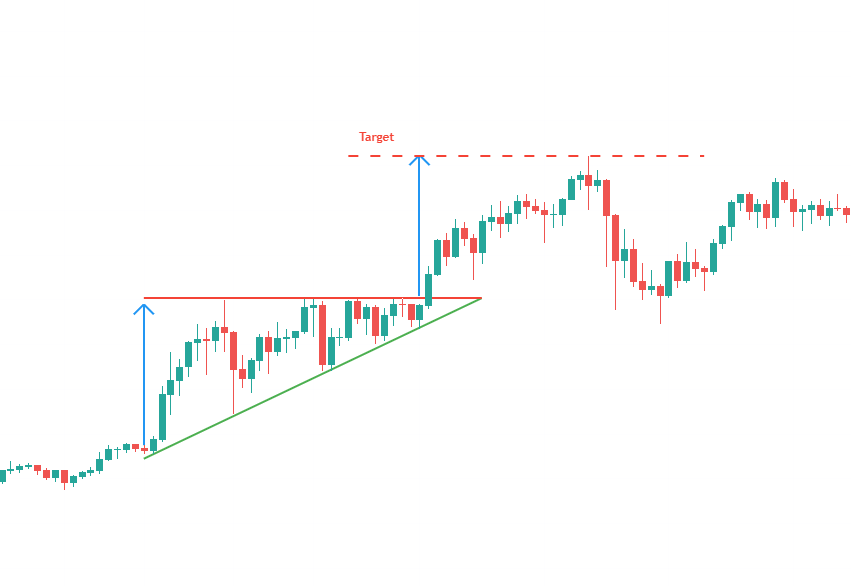
The ascending triangle is a bullish continuation chart pattern. The figure is formed by two converging lines.
The first straight line is a bullish slant providing support, also called the “ascending triangle support line”.
The second line is a horizontal resistance, also known as the “ascending triangle resistance line”.
The ascending triangle is confirmed / valid if it has oscillation between the two lines.
The ascending triangle pattern is considered valid if the price touches at least 3 times the support line and 2 times the resistance line (or at least 2 times the support line and 3 times the resistance line).
The price objective of an ascending triangle is determined by the height of the base of the triangle which is carried over to the breakout point (above the resistance). Another technique is to draw a parallel to the line of support of the ascending triangle from the first contact with the resistance.
Notes and Statistics: #
- The exit is most often done at 2/3 of the triangle. This is the output level that offers the best performance.
- The target price of the ascending triangle is generally reached before the point of the triangle.
- Avoid taking a position if the break / exit occurs before 2/3 of the triangle.
- Supporting pullbacks on the resistance line of the ascending triangle are detrimental to performance.
- In 62% of cases, the exit is bullish.
- In 75% of cases, the ascending triangle is a continuation figure.
- In 75% of cases, the price target of the triangle is reached when resistance is broken on the upside.
- In 60% of the cases, the price carries out after exit a pullback in support on the line of resistance of the triangle.
- In 25% of cases, the price shows false line breaks, or false triangle exits.
Ascending Flag #
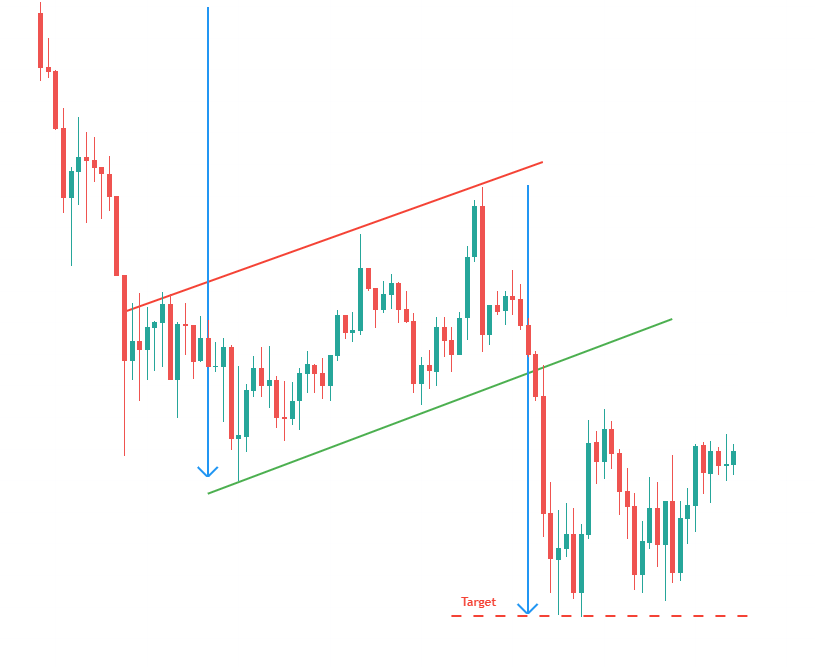
The ascending flag (bear flag) is a continuation figure. The flag is formed by two parallel bullish lines which form a rectangle. It is therefore oriented in the opposite direction of the trend it consolidates. Unlike a bullish channel, this pattern is very short term and signals the need for sellers to take a break.The formation of the ascending flag occurs in a downtrend. Most often, this pause occurs halfway through the movement.
The calculation of the objective is done in relation to the initial trend. We calculate the height of the entire downward movement preceding the formation of the ascending flag and then we report this height to the last high point of the figure.
Notes and Statistics: #
- The more powerful the movement preceding the formation of the flag, the more powerful the movement following the bearish exit.
- The performance of a flag is much less important when it is oriented in the direction of the trend.
- A flag with narrow lines is more efficient than a flag with wide bands.
- A flag is more powerful if there are no false breaks.
- Pullbacks are bad for the performance of the figure.
- In 87% of cases, there is a bearish exit.
- In 62% of cases, the objective of the figure is achieved.
- In 10% of cases, a pullback occurs on the support.
- 76% of descending flags occur in the upper 1/3 of the annual range.
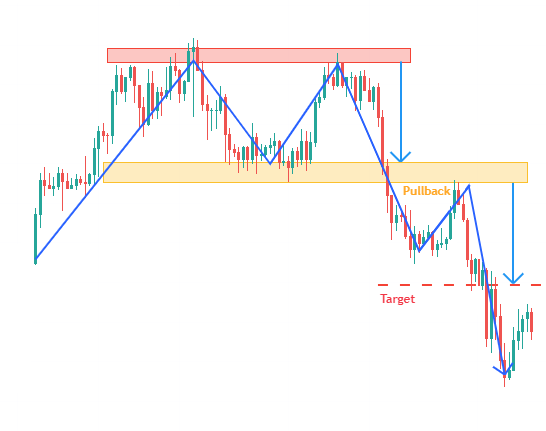
Head & Shoulders #
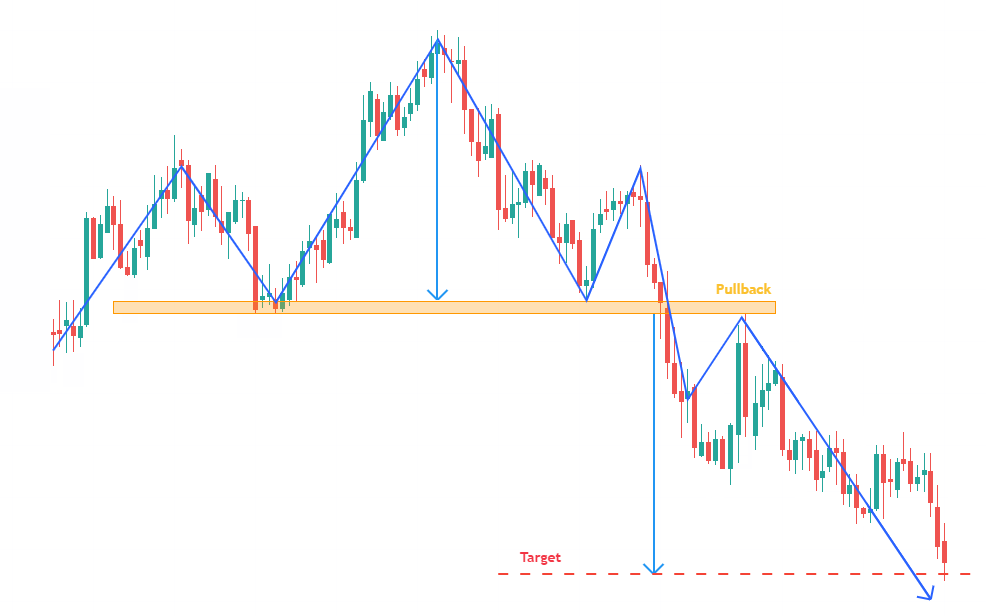
Head and Shoulders are trend reversal chart patterns. In theory, the height of both shoulders should be the same, and the neck line should be horizontal. In practice, it often happens that the shoulders are not the same height, or that the neck line is ascending or descending (depending on the shape of the shoulders of the figure).
The first and third peak (approximately the same height) form the shoulders.
The second top (at a height higher than that of the shoulders) forms the head.
There is no fixed rule but some authors consider that the height of the head should be 1.5 to 2 times that of the shoulders.
The neck line is determined by the two highest highs reached after the first shoulder and the head. These two high points are not always at the same level. The neck line can therefore be ascending, descending or more rarely, horizontal.
The head and shoulders figure is definitively validated at the break of the neck line. The target price is equal to the height between the neck line and the top of the head, carried over the neck line.
Notes And Statistics: #
- In 93% of the cases, the exit of the head and shoulders pattern is bearish.
- In 63% of the cases, the course achieves the goal of the head and shoulders figure when the neck line is broken.
- In 96% of the cases, the bearish movement continues at the break of the neckline.
- In 45% of cases, after exit, the price performs a resistance pullback on the neck line of the head and shoulders figure.


