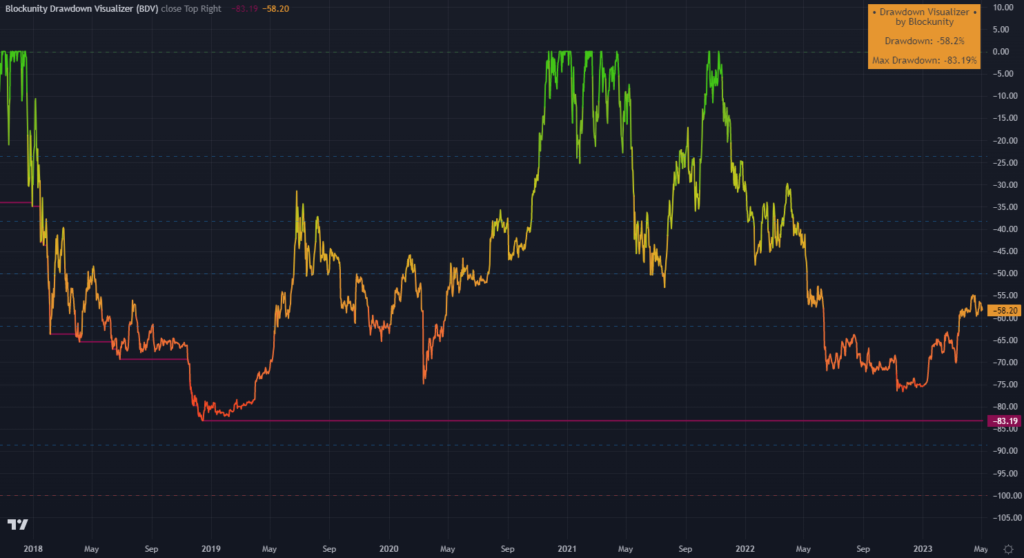
This very easy to understand metric allows you to visualize the drawdown of any asset in the most visual way possible. Its color gradient shows you at a glance the state of the retracement from the asset’s highest price level. You can also, as an option, display the colorization of the oscillator directly on your chart. In addition, its panel directly displays the drawdown statistics in a textual way.
Usage advice #
There are no specific guidelines for this indicator. It works on all timeframes and all assets. You can ideally use it in addition to the Blockunity Pivot Identifier (BPI).
The different Elements #
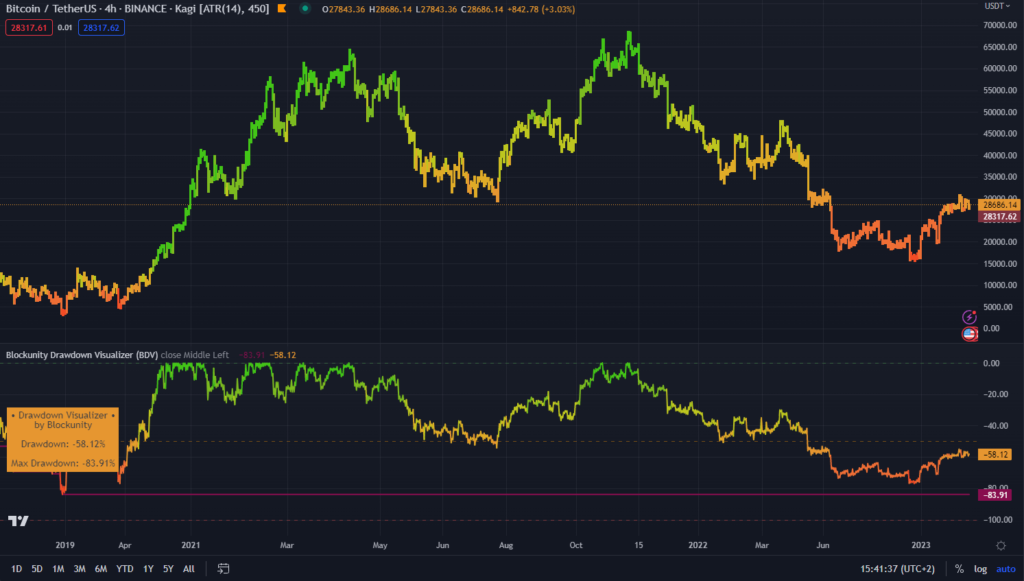
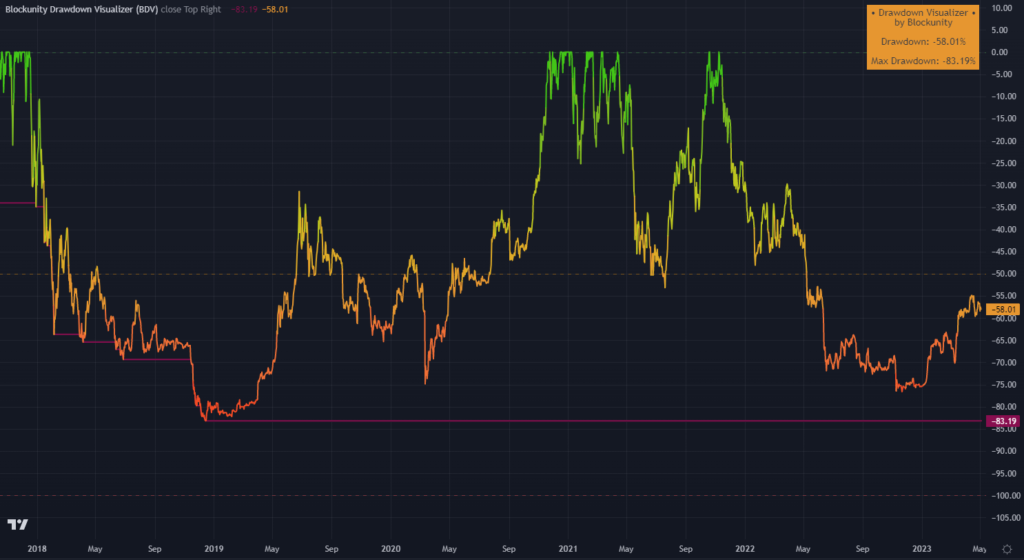
- This indicator is mainly composed of an oscillator. It allows you to see the drawdown of any asset as efficiently as possible. The color of the drawdown line varies according to its status. A red tone indicates a high drawdown, a green tone indicates a low drawdown. The dark red line indicates the max drawdown (highest recorded decline) of the asset.
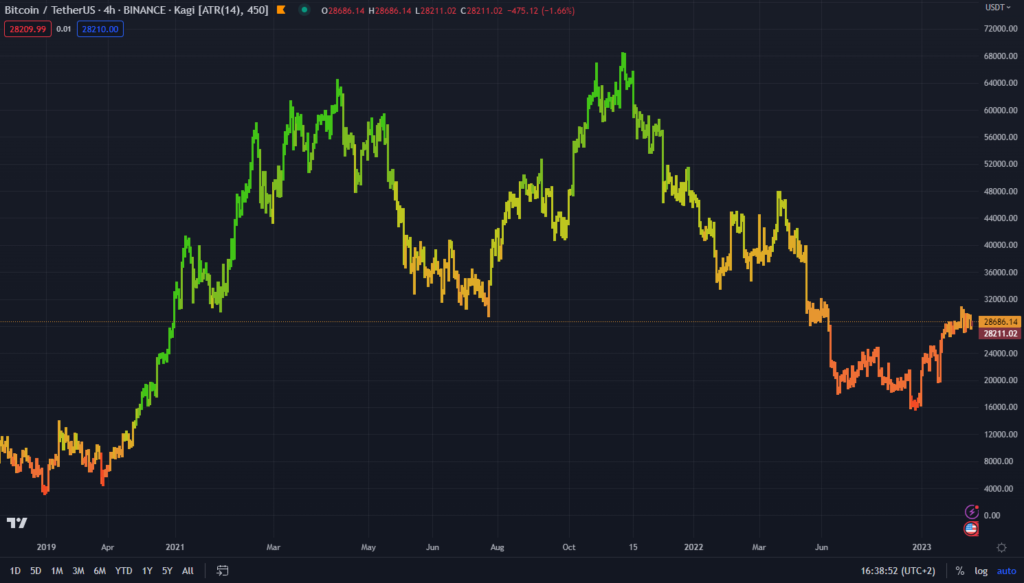
- Alternatively, by checking the “Activate Bar Color” option in the indicator settings and selecting “High-low” or “Kagi” in the “Bar’s style”, you can get the colorimetry of the oscillator directly on your chart. Or right-click on your chart, go to Settings, then uncheck “Borders” and “Wick”.
- Finally, checking the “Display Fibonacci Levels” option in the indicator’s settings will display the 5 main Fibonacci levels. These levels can act as support or resistance.
Settings #
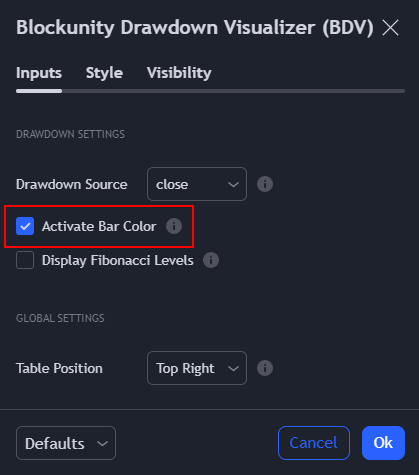
The configurable parameters of the BDV indicator are as follows:
- Drawdown Source: Choose which OHLC element to use to define the starting point of the drawdown calculation. Generally this choice is between close or high, by default it is on close.
- Activate Bar Color: Colors the bars of the graph according to the state of the drawdown. To correctly display this parameter, it is better to use the Bar’s style ‘High-low’ or ‘Kagi’.
- Display Fibonacci Levels: Shows the Fibonacci levels on the drawdown.
Panel information #
The panel of this indicator gives two statistics:
- Drawdown: It is the measure of the decline from a historical peak of the asset. It is always negative (or equal to 0 at a new peak) and indicated in percentage.
- Max Drawdown: Based on the same principle as the Drawdown, this indication gives the maximum value of decline that has been recorded.
Indicator link #
https://www.tradingview.com/script/ndDGo3BK-Blockunity-Drawdown-Visualizer-BDV/
Please click on the Boost button of our indicators!
And don’t forget to follow us on TradingView so you don’t miss any updates: https://www.tradingview.com/u/Blockunity/