
This tool automatically displays many points of interest on the charts of any asset, on extreme or intermediate price levels. It also automatically shows Fibonacci levels, in retracement or in extension. This makes it very useful to easily detect support or resistance zones, and place orders in advance. Moreover, its panel displays information about the ATH and ATL of the selected asset in order to have these statistics quickly under view.
Usage advice #
There are no specific guidelines for this indicator. It works on all time units and all assets. We still recommend using your chart in linear for better visualization, but this is optional.
You can suppress the display of certain elements in the settings if you find the graph too much charged.
The different elements #
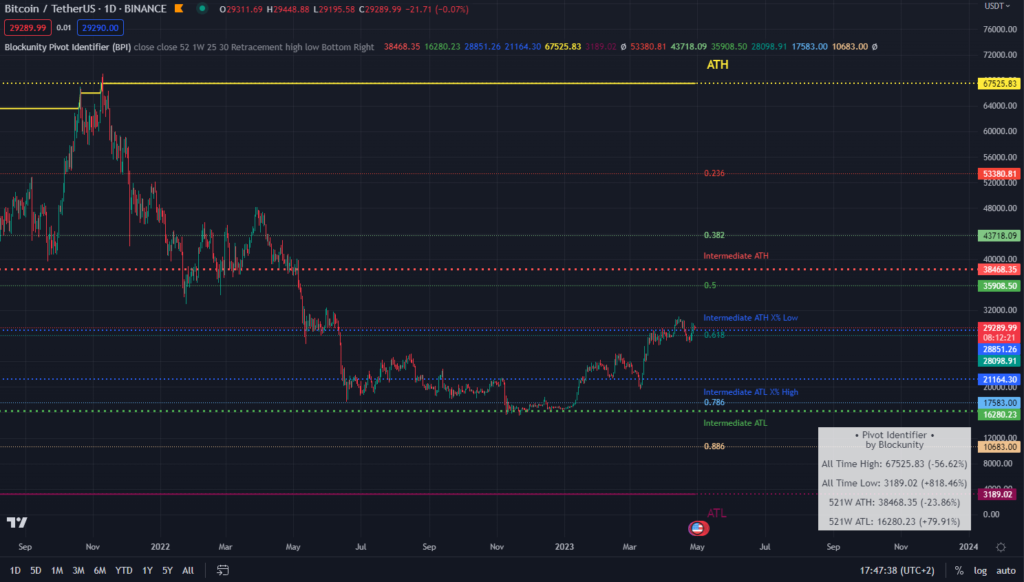
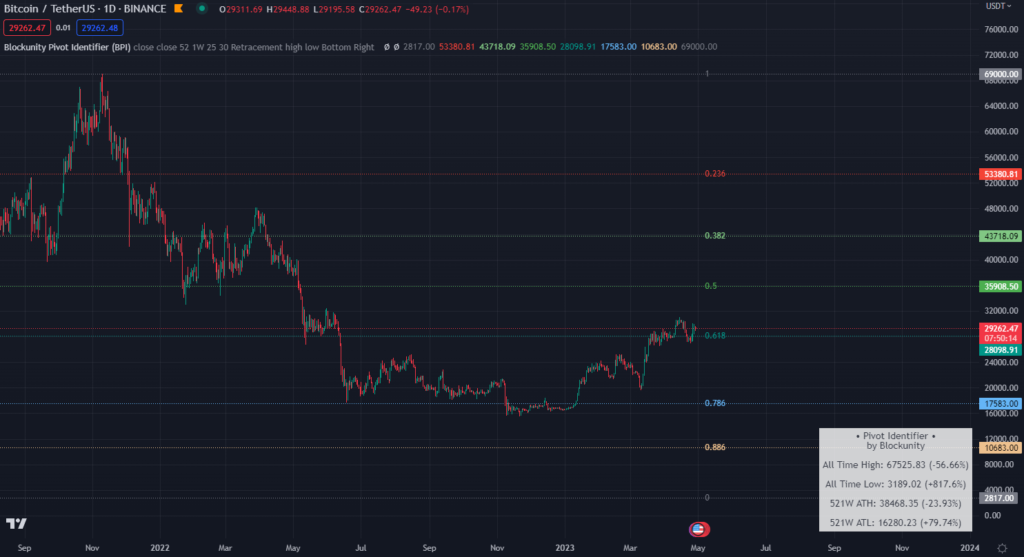
On your chart, you can find :
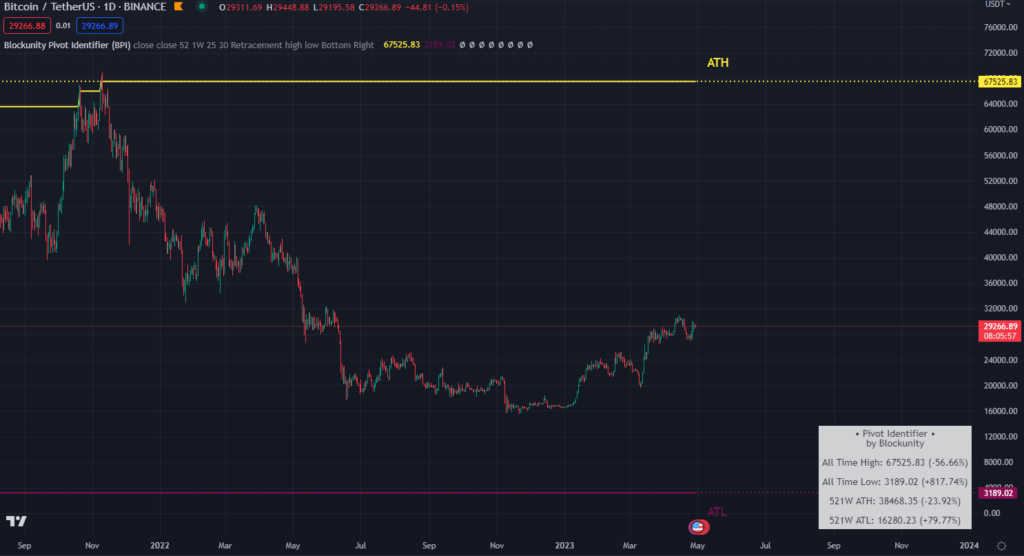
- The All Time High (highest historical level) and the All Time Low (lowest historical level) of the asset.
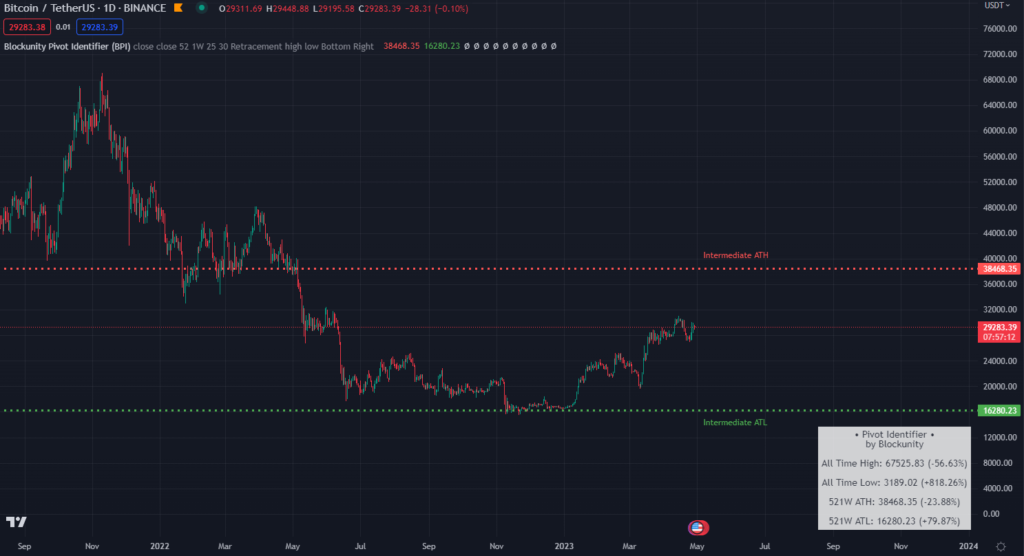
- The Intermediate All Time High and Low. By default, this value is set at 52 weeks. In general, the 52 week high represents a resistance level, while the 52 week low is a support level. These periods are configurable in the indicator settings. For example, by putting ’30’ in the ‘Intermediate All Time Lookback’ field and ‘1 day’ in the ‘Intermediate All Timeframe’ field, the intermediate ATH and ATL will be calculated based on the last 30 days.
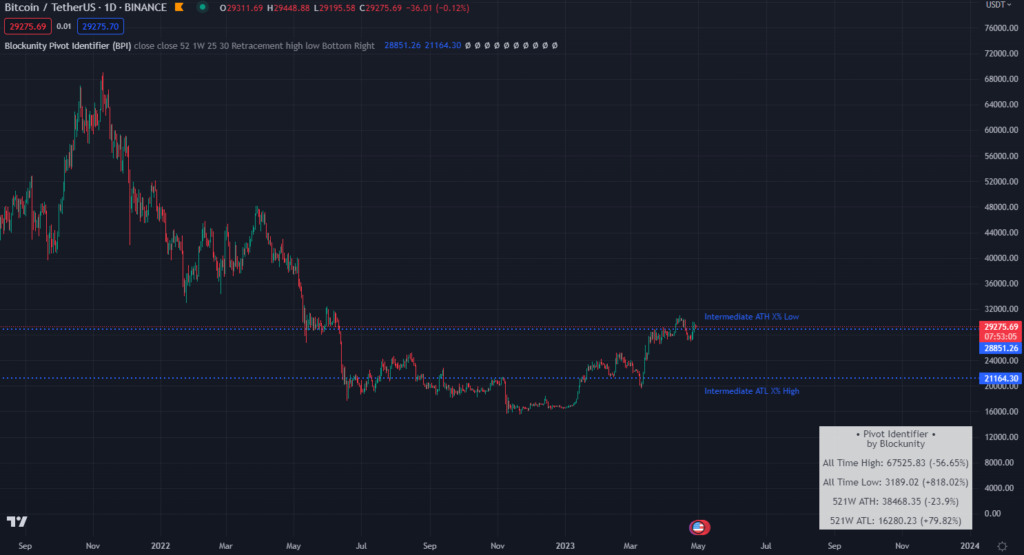
- The levels X% lower than the intermediate ATH and X% higher than the intermediate ATL. By default, the value of -25% can be considered as resistance, and the value of +30% can be considered as support. These two values are also configurable in the parameters.
- Finally, it is possible to automatically display Fibonacci Levels. You can choose between retracements or extensions using the ‘Mode’ setting in the indicator configuration.
Settings #
The configurable parameters of the BPI are as follows:
- ATH Source: Choose which OHLC element to use to define the All Time High. Generally this choice is between close or high, by default it is on close.
- ATL Source: Choose which OHLC element to use to define the All Time Low. Generally this choice is between close or low, by default it is on close
- Show ATH & ATL Lines: Uncheck this box to not display the ATH and ATL lines.
- Intermediate All Time Lookback: Define the period to be taken into account to define the intermediate ATH and ATL.
- Intermediate All Time Timeframe: Define the timeframe to take into account when defining the intermediate ATH and ATL. By default this is set to 52 weeks.
- Show Intermediate All Time Lines: Uncheck this box to not display the Intermediate ATH and ATL lines.
- Intermediate ATH X% Low: Specify how many % lower than the Intermediate ATH value you want to draw a new line. By default, the value of -25% can be considered as a resistance.
- Intermediate ATL X% High: Indicate how many % higher than the Intermediate ATL value you want to draw a new line. By default, the value of +30% can be considered as a support.
- Show Intermediate All Time X% Lines: Uncheck this box to not display the Intermediate ATH and ATL X% High/Low lines.
Panel information #
The panel of this indicator gives several statistics:
- All Time High: The highest historical value of the asset, as well as the variation between this value and the current one.
- All Time Low: The lowest historical value of the asset, as well as the variation between this value and the current one.
- X-Y ATH: The value of the asset at the intermediate ATH, as well as the variation between this value and the current one.
- X-Y ATL: The value of the asset during the intermediate ATL, as well as the variation between this value and the current one.
The panel color does not vary for this indicator.
Indicator link #
https://www.tradingview.com/script/GOxxxeMS-Blockunity-Pivot-Identifier-BPI/
Please click on the Boost button of our indicators!

And don’t forget to follow us on TradingView so you don’t miss any updates: https://www.tradingview.com/u/Blockunity/