

Blockunity’s Portfolio Overview tool allows you to obtain the most complete and advanced statistics and data about your assets. Currently, it is compatible with Binance (Spot, Earn Flexible, Earn Staking, Earn DeFi).
Statistics #
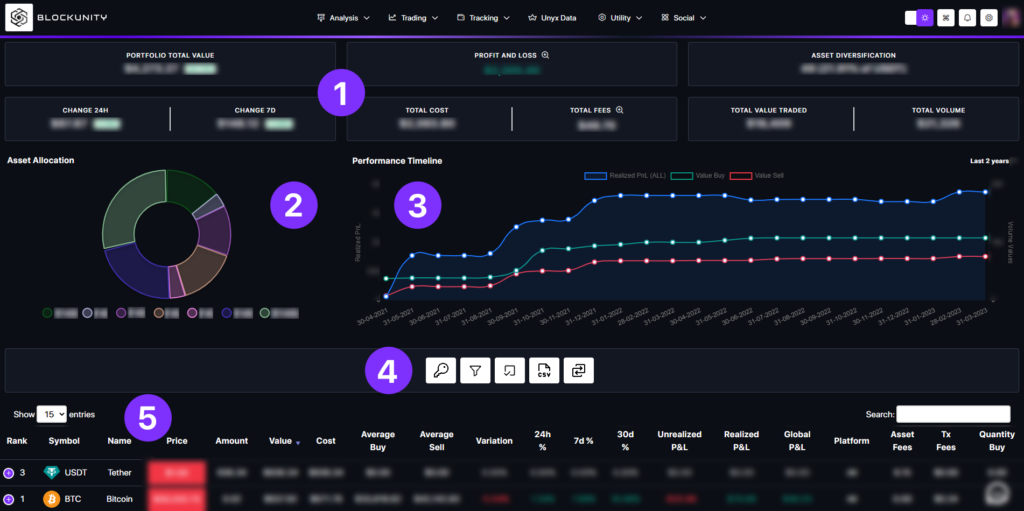
- Portfolio Total Value: Your actual portfolio value ($).
- Profit and Loss: The sum of the Unrealized P&L and the Realized P&L ($) (details of both). Move over the small magnifying glass to see the detail.
- Asset Diversification: The number of assets in your portfolio (and the asset you have the most in %).
- Change 24H: The variation of your portfolio value during the last 24 hours ($ & %).
- Change 7D: The variation of your portfolio value during the last 7 days ($ & %).
- Total Cost: The total amount of FIAT that you have injected to invest in crypto ($).
- Total Fees: The total amount of your fees, consisting of your trading fees, deposits, withdrawals, and FIAT payments ($). Move over the small magnifying glass to see the detail.
- Total Value Traded: The total value of your buys and sells ($).
- Total Volume: The total value of all movements and transactions (trading, deposits and withdrawals).
Asset Allocation #
This graph shows you the proportion of the main assets you have in your portfolio. Move your mouse over the graph to get the percentages.
Performance Timeline #
There are 3 important statistics on the timeline :
- Realized P&L, in blue, which shows all the profits and losses you have made over time (corresponds to the left scale).
- Value Buy, in green, show the total volume of your purchases (corresponds to the right scale).
- Value Sell, in red, indicates the total volume of your sales (corresponds to the right scale).
You can click on the text at the top right of the graph, “Last 2 years” in our example, to change the time horizon:
- Last 7 days.
- Last 30 days.
- Last 6 months.
- This year.
- Last 2 years.
The statistical values are cumulative.
More Actions #

- Visualize, add or remove your API Keys. Visit the documentation to add your API Key by clicking here.

- Apply filters on section (5).

- Choose the column to display on section (5).

- Export all your data in CSV format.

- Manage manual transactions to ensure that your tracking is fully completed.
Table of your assets #
Here tou can visualize all your assets in the slightest details. You can even click on the + ( on the left side of each row) to display additional data.
- Rank: Ranking of the asset in terms of its market cap.
- Symbol: Symbol of the asset.
- Name: Name of the asset.
- Price: Live price of the asset ($).
- Amount: Quantity of assets held.
- Value: Value of the assets in the portfolio ($).
- Cost: Estimation of the acquisition cost of the quantity held of the asset ($).
- Average Buy: Average purchase price of the asset ($).
- Average Sell: Average selling price of the asset ($).
- Variation: Variation between Cost and Value (%). Shows you your percentage gain or loss on the asset.
- 24H%: Variation of the price during the last 24 hours (%).
- 7d%: Variation of the price during the last 7 days (%).
- 30d%: Variation of the price during the last 30 days (%).
- Unrealized P&L: Value of the current positions, which have not yet been sold, deducting the Cost. ($).
- Realized P&L: Value of the realized positions, which have been sold, removing the Cost ($).
- Global P&L: The sum of Unrealized P&L and Realized P&L ($).
- Platform: Indicates the primary source where the asset is held.
- Asset Fees: Quantity of the asset used for transactions fees.
- Tx Fees: Cost of all transactions fees ($) for this asset.
- Quantity Buy: The number of coins/tokens purchased.
- Quantity Sell: The number of coins/tokens sold.
- Quantity Deposit: The number of coins/tokens deposited.
- Quantity Withdraw: The number of coins/tokens withdrawn.
- Quantity Dividend: The number of coins/tokens received as airdrop, reward or investment income.
- Quantity Volume: Sum of the 4 previous quantities.
- Value Buy: Cost of all purchases of the asset ($).
- Value Sell: Value of all sales made on this asset ($).
- Value Volume: The value of all movements on this asset ($).
- Action: Display the Performance Timeline and All Transactions of the asset.


