

Stochastic RSI #
Created in 1994 by Tushar Chand and Stanley Kroll, the stochastic RSI, also known as StochRSI, is generated from the RSI by applying the stochastic oscillator formula.
Calculation: #
RSI Stoch = (RSI – RSImin) / (RSImax – RSImin)
On a given period, RSImin is the smallest RSI value and RSImax the biggest.
• A StochRSI higher than 80 indicates an overbought zone.
• A StochRSI lower than 20 indicates an oversold zone.
• The crossing of those two lines can give buying/selling signals.
This indicator is often used to confirm a signal with other tools, because of its high sensitivity to market movements it often gives false signals.
Like the RSI, the StochRSI determines if an asset is oversold or overbought and gives potential reversal points. It is more often reaching its higher and lower bounds than the RSI.
RSI Divergence #
A divergence is formed when the price and an indicateur, here the RSI, give contradictory information. It can be interpreted as a bearish or bullish pressure, by observing a loss of momentum during or at the end of a trend.
Basic divergences:
- Bullish divergence: lower in price, higher lows for the RSI. The bearish pressure isn’t supported, bullish signal.
- Bearish divergence: higher in price, lower highs for the RSI. The bullish pression isn’t supported, bearish signal.
Hidden divergences:
- Hidden Bullish divergence: higher lows in price, lower lows for the RSI. Gives a bullish signal.
- Hidden bearish divergence: The RSI has higher highs but not the price. Gives a bearish signal.
The RSI divergence is used by active traders. It often offers clear and effective signals, enabling more security, even if divergences can accumulate before really getting active.
Bollinger Bands #
Invented in the 80s by John Bollinger, the Bollinger Bands are a technical indicator enabling to rapidly follow the volatility and trend of an asset.
Calculation:
Middle Band = 20-day SMA
Upper Band = 20-day SMA + (20-dat SDF x 2)
Lower Band = 20-day SMA – (20-dat SDF x 2)
SMA is the simple moving average. SDF is the standard deviation of price.
This Indicator, like its name suggests, forms two bands around a line calculated thanks to a 20 day moving average. These bands tighten or slacken depending on the volatility.
The higher bound represents prices statistically higher. The lower bound represents prices statistically lower.
Continually reaching the higher bound is a high buying activity and inversely for the lower bound.
- Bullish trend: The price is higher than the SMA20 or the higher band / the price is above the SMA20.
- Bearish trend: Breaking the lower bound / the price is under the SMA20.
TD Sequential #
Invented by Tom DeMark, the TD Sequential is a technical indicator identifying reversal points on the market and marking horizontal support and resistance levels. It gives daily and intraday signals.
It contains TD Setup and TD Countdown figures.
TD Setup is formed by 9 consecutive bars, generally marked in green (from 1 to 9).
TD Countdown is formed by 13 not necessarily consecutive bars, generally marked in red (from 1 to 13).
The TD9 is a buying signal of the TD Sequential. It appears when the last nine candles were all below the preceding four candles.
This indicator is often used by traders but can be complex for beginners.
Moving Average Convergence Divergence (MACD) #
Developed in 1979 by Gerald Appel, the MACD (Moving Average Convergence Divergence) is a type of oscillator and a trend following technical analysis tool used to detect asset momentums.
Calculation:
MACD = EMA12 – EMA26
The EMA is the moving average giving more weight to the most recent prices. 12 and 26 are the periods.
The mean value of MACD is 0 and has no limits. A high value indicates a falling trend, a low value indicates a rising trend.
This indicator consists of two lines, the MACD line and the signal line, as well as a histogram indicating the difference between these two. It is adapted for short term investments and must be coupled with other indicators like the RSI.
- Rising signal: the MACD line crosses the signal line from the bottom.
- Falling signal: the MACD line crosses the signal line from the top.
- Bullish trend: the MACD line is above 0.
- Bearish trend: the MACD line is under 0.
Ichimoku #
Developed in the 30s and published in 1968 by Goichi Hosoda, the Ichimoku Kinko Hyo technique is a trading method enabling one to follow and predict market trends.
In this indicator we find 5 main elements:
- Chikou Span or Lagging Span: Price line shifted by x periods.
- Kijun-Sen: Trend line.
- Senkou Span A (SSA): Main extension A.
- Senkou Span B (SSB): Mai extension B.
- Tenkan-Sen: Signal line.
Calculation:
Kijun-Sen = (Highest Point + Lowest Point)/2 (on P1 last periods)
Tenkan-Sen = (Highest Point + Lowest Point)/2 (on P2 last periods)
Chikou Span = Delayed closing of P1 periods
Senkou Span A = (Kijun-Sen + Tenkan-Sen)/2 (on P1 last periods)
Senkou Span B = (Highest Point + Lowest Point)/2 (on 2*P1 last periods, extended over P1 period)
P1 : medium-term period, generally 26.
P2 : short term period, generally 9.
- Buying Signal: The Tenkan-Sen crosses the trend line in an up-trend. Reinforced if Chikou-Span is above the close price.
- Selling Signal: The Tenkan-Sen crosses the trend line in a down-trend. Reinforced if Chikou-Span is under the close price.
- Bullish trend: The Kijun-Sen breaks the course upward.
- Bearish trend: The Kijun-Sen breaks the course downward.
- Cloud (gap between Senkou Span A and B): serves as a support or resistance.
The Tenkan-Sen and Kijun-Sen are also elements of support and resistance. Furthermore, the Chikou Span can also find support or resistance on every element it crosses, even price candles.
Commodity Channel Index (CCI) #
Elaborated by Donal Lambers in the 80s, the Commodity Channel Index (CCI) is a technical indicator of the oscillator family indicating overbought and oversold zones, as well as divergences of the asset. It approximates the stochastic.
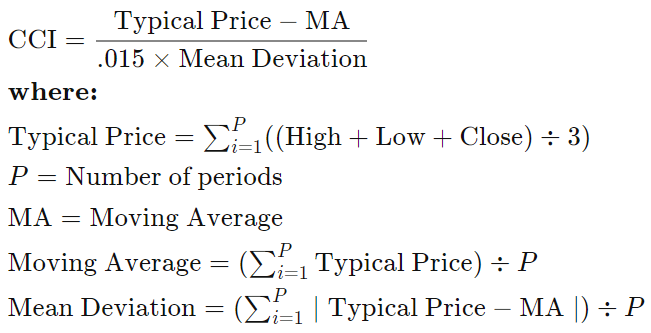
This indicator is usually represented with values going from -500 to 500.
To remember important information, two lines are drawn at -100 and 100.
- A CCI higher than 100 indicates an overbought zone.
- A CCI lower than -100 indicates an oversold zone.
- A CCI who doesn’t manage to reach its old highs/lows while the price manages to do so, indicates the presence of bullish/bearish divergences.
It is very difficult to make a decision only regarding this indicator, very subjective and sometimes giving false signals.
Relative Strength Index (RSI) #
The RSI, Relative Strength Index, is a popular technical indicator who measures the strength of the trend of an asset.
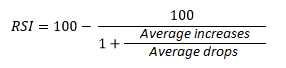
Its parameter, by default 14 if your graph is on a daily timeframe, indicates that the calculation of the RSI is taking into account the last 14 days. Its value is between 0 and 100. Some values have to be looked at more closely:
- Between 0 and 30 the asset is oversold, the price will likely bounce back up, but the bears are in charge.
- Breaking the 30 from the bottom indicates a return of buying power.
- Between 70 and 100 the asset is overbought, a price correction is most likely to happen, but the bulls are in charge.
- Breaking the 70 from the top indicates a return of selling power.
- The neutral zone is between 30 and 70.
The indicator allows to determine the strength and the direction of a trend and can indicate potential reversals.


