The aim of this section is to analyze the reactions of the market on specific price areas in order to detect supports, resistances or trend lines.
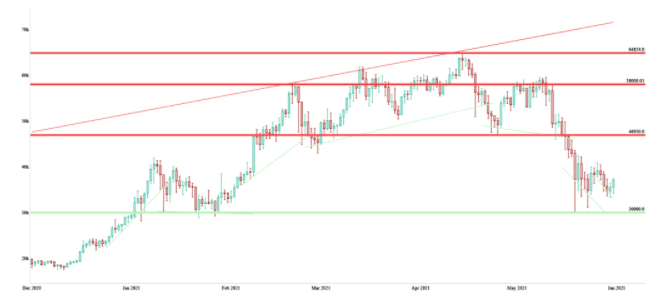
Support and resistance levels are fundamentals of the technical analysis in trading.
- Resistance: Level at which bullish movements can be stopped. We can observe a level the asset seems struggling to get over. This level can be considered as an interesting level to sell, since when reached, the asset tends to be bearish. Note that the more a resistance is attained the more chances it has to break. The difficulty being to know how to identify resistance levels.
- Support: Contrary to a resistance, a support is a level from which the bearish movements are stopped. A support can indicate the end of a bearish period and therefore announce a trend reversal for an asset. A support is often an interesting entry level for buyers. Like the resistance, the more a support level is attained the more chances it has to break. On the cryptomarket, supports can be more difficult to identify than on stable markets, because the assets are way more volatile and frequently break briefly their levels.
Trend lines can also be considered as levels of resistance and support.
- Trend line: Ascending line (bullish trend) or descending line (bearish trend) which serves as support or resistance. It is useful in order to identify the base trend of an asset.