
This powerful trading indicator is accompanied by a strategy based on the momentum of an asset that aims to make trades over the medium term. According to TradingView’s Strategy Tester, from January 1, 2020 to mid-February 2023, this strategy would have made nearly 1,000% profit on Bitcoin with a maximum drawdown of 35%, while the Buy & Hold would have made only 232% profit.
Usage advice #
This strategy can only be used on certain defined assets, for which we have adjusted its parameters to obtain optimized results. It is ideally used on a daily timeframe, but more compatibility will come. To see the list of available assets and time units, please refer to the changelog available on TradingView. It is recommended to use your chart in logarithmic scale.
The different elements and signals #
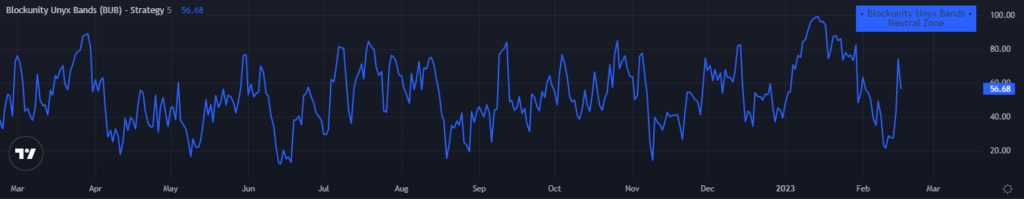
- The main component is a derivative of the RSI. It measures the amplitude of the movements of the selected asset to evaluate if it is overbought or oversold. It is ranged from 0 to 100.
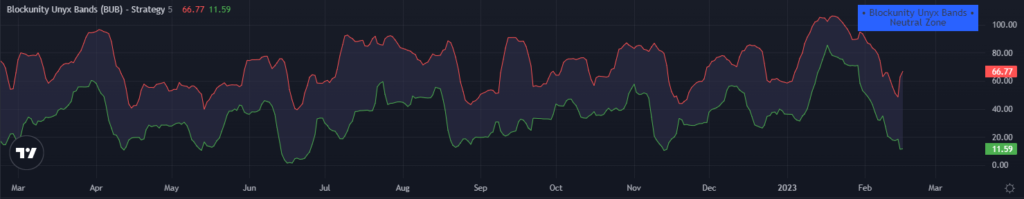
- Around the RSI are Bollinger Bands indicating the overbought and oversold areas mentioned earlier. When the RSI re-enters the bands from above, the strategy will indicate a Short signal (sell – price down). When the RSI re-enters the bands from below, the strategy will indicate a Long signal (buy – price up).
- In the background, the strategy also calculates a trend indicator, so that you always take a position in the same direction as the market trend.
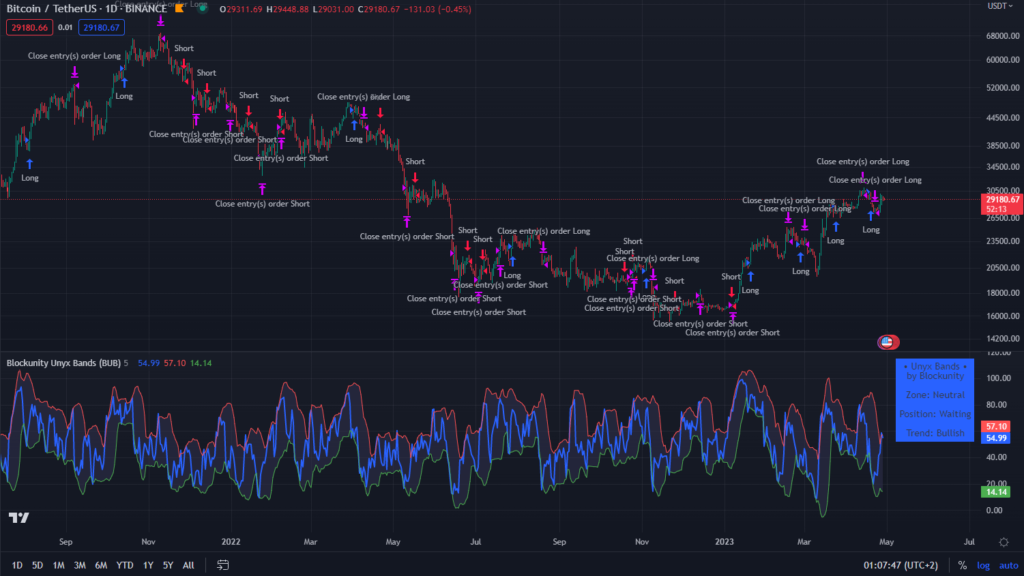
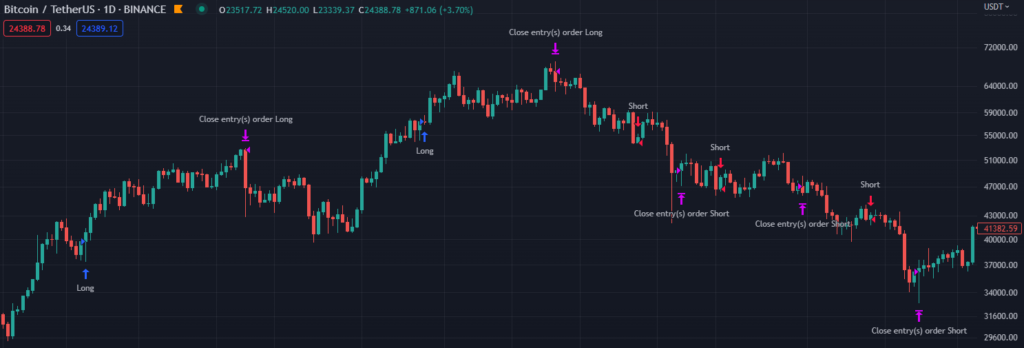
- Finally, we find the trading arrows/signals on the chart. They allow you to apply the strategy described above, by opening long and short positions, as well as closing these positions. The blue arrows indicate the opening of a Long (buy) position, while the red arrows indicate the opening of a Short (sell) position. The purple arrows indicate the closing of the positions. However, a Short signal that precedes a Long trade should also be interpreted as a signal to close the Long position. Conversely, a Long signal that precedes a Short trade should also be interpreted as a signal to close the Short position.
Settings #
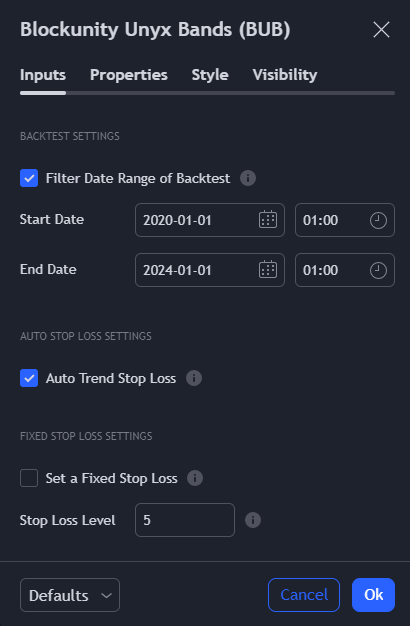
By opening the parameters of the indicator, you get the following items:
- Flter Date Range of Backtest: When this box is checked, it allows you to adjust the backtest period available in the ‘Strategy Tester’ tab of TradingView by entering the desired dates in ‘Start Date’ and ‘End Date’. If this box is not checked, the backtest will be done on the whole history available for the asset. Be sure to uncheck this setting or configure it properly if you want to get real-time signals.
- Auto Trend Stop Loss: When enabled, it will close the current position if a trend change occurs, to avoid keeping an open position against the trend. Enabled by default.
- Set a Fixed Stop Loss: When enabled, please make sure to indicate in the « Stop Loss Level » box how much of a % you want to place your Stop Losse, which will automatically close the positions if the threshold is reached. This can be in addition to or instead of the ‘Auto Trend Stop Loss’. Disabled by default.
- Fixed Stop Loss Level: Fixed Stop Loss level in percent from entry price.
Panel information #
Like all Blockunity indicators and strategies, we find a box that gives several information:
- The zone in which the asset is located. This one indicates “Selling” on a red background when the RSI is above the red line, “Buying” on a green background when the RSI is below the green line, and “Neutral” on a blue background when the RSI is inside the Bollinger Bands.
- The position that is currently taken by the BUB. It indicates here whether it is currently Long, Short, or out of position (waiting).
- The trend he has identified. It can be either bullish or bearish.
Indicator link #
https://www.tradingview.com/script/95ezvir2-Blockunity-Unyx-Bands-BUB/
Please click on the Boost button of our indicators!
And don’t forget to follow us on TradingView so you don’t miss any updates: https://www.tradingview.com/u/Blockunity/