
The goal of this indicator, based on several technical analysis metrics, is to help investors quickly and efficiently visualize whether an asset appears to be in a buy or sell zone. It works in a simple way, with a color code and a score, as well as arrows giving signals.
Usage advice #
This indicator can be used on its own, ideally in daily or weekly timeframes, but it also works with other periods. With the « BRS Timeframe » setting, it is possible, for example, to see the BRS values and signals calculated on a daily basis while being on a weekly timeframe chart. Use your graph in logarithmic scale.
The zones and signals indicated by the BRS can be effectively coupled with a DCA strategy.
If the asset you wish to observe has been listed very recently or has limited history, enable the “Very young asset” option in the BRS settings.
If you want to observe assets that are not cryptoassets, make sure to set the BRS settings “Market Mode” to the option “Traditional”.
The Different Elements And Signals #
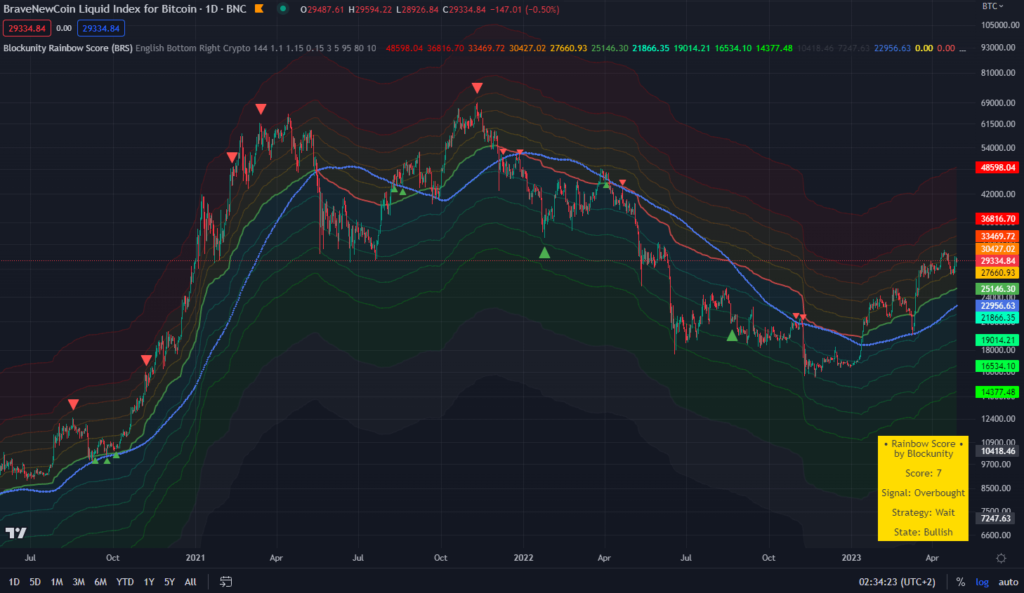
- The base of this indicator is first of all an optimized moving average, taking into account the volatility of the asset. This varies from green to red depending on whether the asset price is above or below this average.
- Around this baseline are formed several bands. The lower bands (blue to green shades) form oversold areas. In these regions, it is recommended to buy rather than sell. Conversely, in the upper areas (yellow to red tones), represent overbought levels. It is then recommended to make sales.
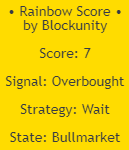
To see at a glance in which zone we are currently located, we have added a panel with the score and the current signal.
The table below describes the different zones:
| Score | Signal |
|---|---|
| 0 | Deadcoin |
| 1 | Extremely Bullish |
| 2 | Strongly Bullish |
| 3 | Clearly Bullish |
| 4 | Bullish |
| 5 | Neutral + |
| 6 | Neutral – |
| 7 | Bearish |
| 8 | Clearly Bearish |
| 9 | Strongly Bearish |
| 10 | Extremely Bearish |
- In the panel there is also a strategy indication. This indication is coupled with the arrows (red, green and blue) that can be seen scattered across the chart.
- These arrows indicate when the asset is considered to be at an inflection point, a change in trend. Behind this is a mechanism that takes into account volatility , momentum and trend. The green arrows indicate buying opportunities and the red arrows indicate selling times. The blue arrows (optional display to be activated in the parameters) give indications with less confidence, they are weaker but more aggressive signals. The signal is to be taken up or down depending on the direction of the arrow.
- Finally, we give an indication of the market phase in which the asset is situated. Above the main line we consider to be in a bullish market and below in a bearish market.
Settings #
By opening the parameters of the indicator, it is possible to :
- Language Selector: Choose between English or French for the table informations
- Table Position: Choose where to display the table of indications.
- Market Mode: Change this setting depending on the asset market you wish to view. Select Crypto for all crypto assets and Traditional for other markets. This will change the BRS settings to better fit the volatility of different markets.
- Very young asset: Check this box if the asset has just been listed or has very limited history. Only used when Market Mode is set to Crypto.
- Adjust the base MA to the volatility: Indicate if you prefer to have the base moving average adjusted to market volatility or if it should be simple.
- Base MA length: Indicates the length of the central moving average.
- Coefficient size of high bands: Coefficient allowing to act on the density of the high bands. Can be modified for assets with a too specific volatility in order to adjust the bands and thus modify the selling zones.
- Coefficient size of low bands: Coefficient allowing to act on the density of the low bands. Can be modified for assets with a too specific volatility in order to adjust the bands and thus modify the buying zones.
- Coefficient of volatility: This parameter allows to adjust the reactivity of the central moving average (only if the ‘Adjust the base MA to the volatility’ box is checked). The higher the value, the more responsive the MA will be to movements. The lower the value, the slower the MA will be. Default: 0.15.
- Activate time filtering: Checking this box will eliminate signals that retrigger too close to a previous one. Enabled by default.
- Triggering factor: Choose witch levels will trigger the buy/sell signals. A value of 1 will only give signals in the most extreme bands, 2 will give signals in the 2 most extreme bands, and 3 in the 3 most extreme bands.
- Activate MA filtering: This parameter adds an ultra-short term moving average to the signal triggering conditions. This can help to eliminate possible false signals or to keep only the strongest signals.
- Show extreme signals: Display or not the buy/sell signals that can be triggered at extreme point of the BRS bands.
- Retest gap (%): Specify the maximum percentage deviation you wish to include in the calculation of the central moving average retest signals (Divided by 5 in the Traditional Market Mode).
- Adjust the retest MA to the volatility: Indicate if you prefer to adjust the MA used for restest signals to the asset volatility or if it should be simple.
- Show retest signals: Display or not the buy/sell signals that can be triggered around the central moving average.
- Show potential retest signals: Display or not the buy/sell signals that can be triggered around the central moving average, and that have a lower confidence level.
- Some design settings: Opacity of the bands, Opacity of the lines, and Show BRS bands.
Panel information #
The indicator panel provides the following information:
- Score : From 0 to 10 (see table).
- State: See table.
- Signal: Sell / Buy / Retest – Sell / Retest – Buy / Potential Retest – Sell / Potential Retest – Buy.
- Market: Bullish/ Bearish.
The color of the panel varies according to the zone in which the asset is located. This color is correlated to the indicator’s bands.
The panel color does not vary for this indicator.
Indicator link #
https://www.tradingview.com/script/kHMIMYpn-Blockunity-Rainbow-Score-BRS/
Please click on the Boost button of our indicators!
And don’t forget to follow us on TradingView so you don’t miss any updates: https://www.tradingview.com/u/Blockunity/