
This powerful indicator allows to detect possible major market reversal points by correlating trend strength indicators and specific calculation methods. Several presets are available to adjust the indicator parameters according to the user’s profile. The panel allows to summarize in real-time the indications presented on the chart.
In addition, its oscillator makes it easier to understand and interpret the given signals. The panel summarizes the status of various embedded indicators.
Usage advice #
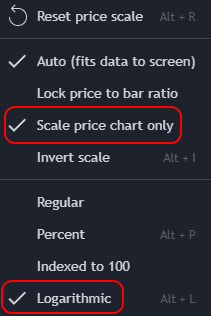
BSR and BSO are best used together. Otherwise, it works on all time units and assets. We recommend, however, that you use the chart in logarithmic and set the scale to price only.
Right-click on the graph scale:
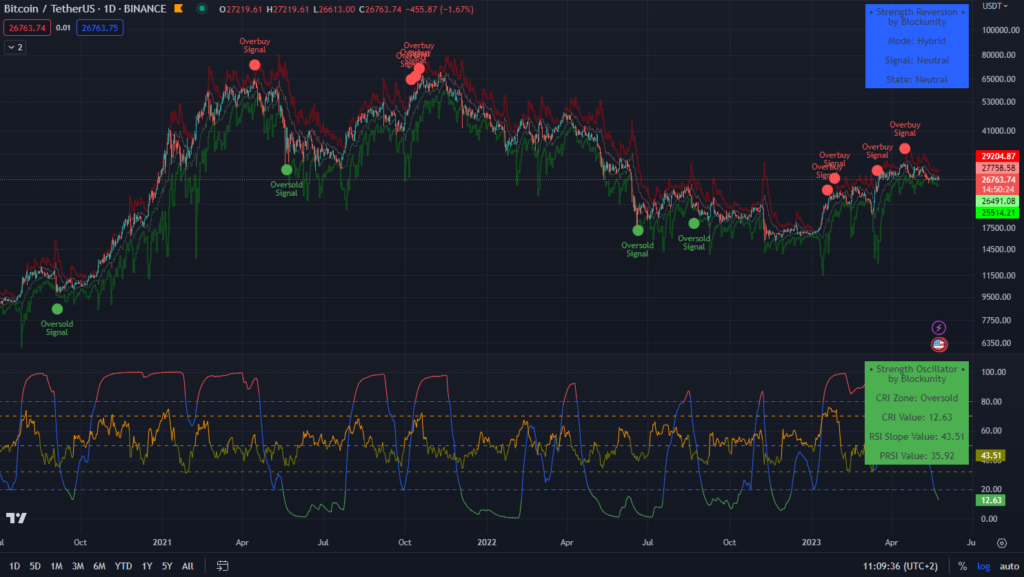
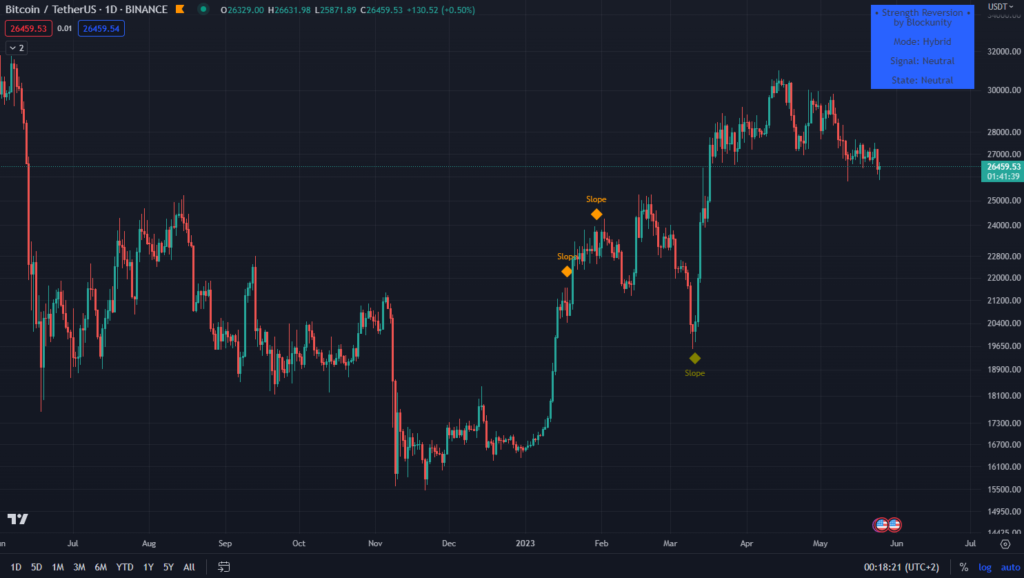
The different elements and signals on the graph #
- The BSR is made up of 4 lines that shape the asset’s price. If the asset remains between the upper or lower bands for long enough, an Overbuy or Oversold signal is respectively sent.
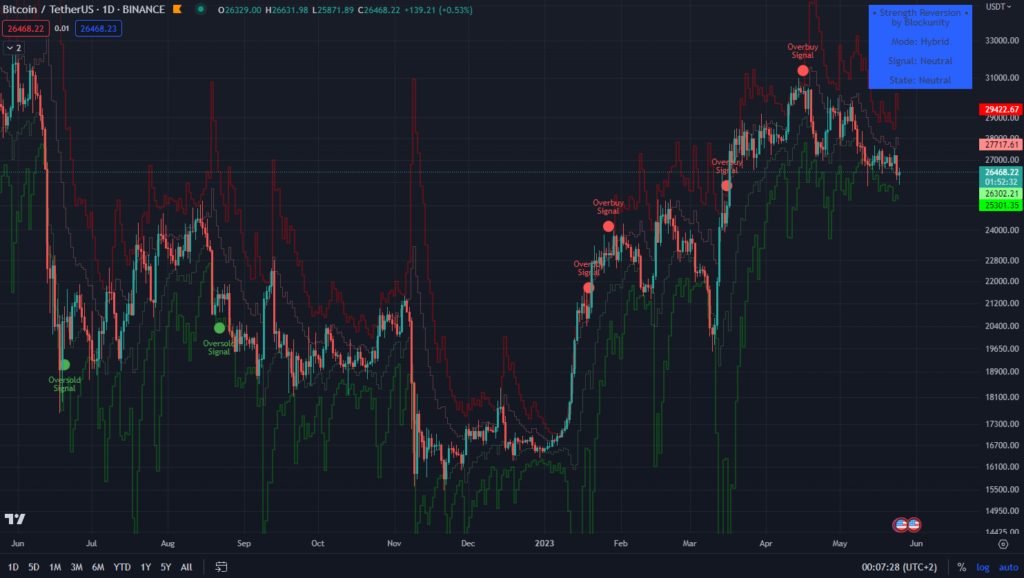
Otherwise, it is possible to activate 3 other types of signal, all derived from different calculation methods related to RSI.
- The Confirmed Reversal Indicator (CRI) gives signals that generally occur after a long or strong period of excess.

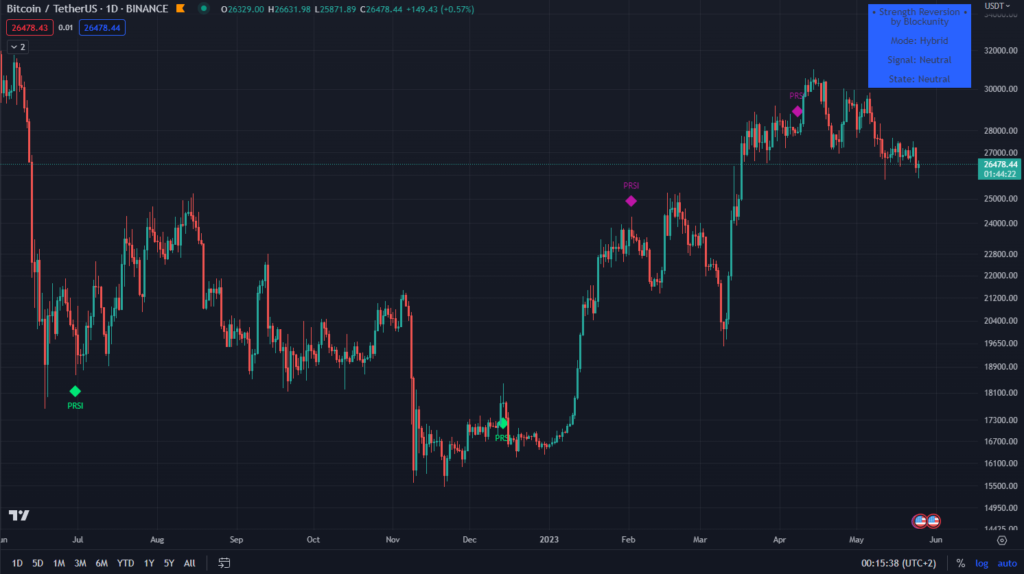
- The Parabolic RSI (PRSI) results from signals that occur in a parabolic phase, in a context of extreme volatility.
- The RSI Slope, for its part, gives signals based on the slope of a classic RSI curve. It rarely gives false signals, but can miss some.
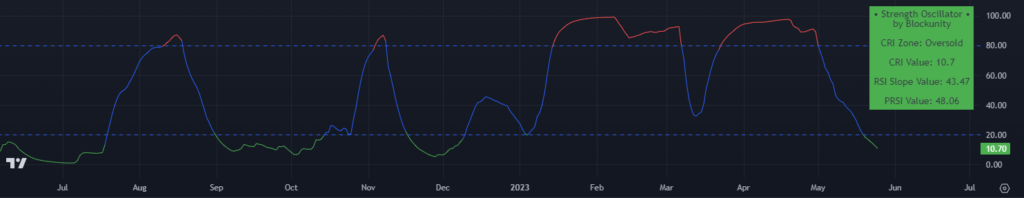
The different elements of The Oscillator #
- By default, the oscillator displays the Confirmed Reversal Indicator (CRI), which allows signals from other embedded indicators to be filtered (can be activated in the parameters). By default, the CRI ranges from 20 to 80, and indicates overbought and oversold zones, colored red and green respectively.
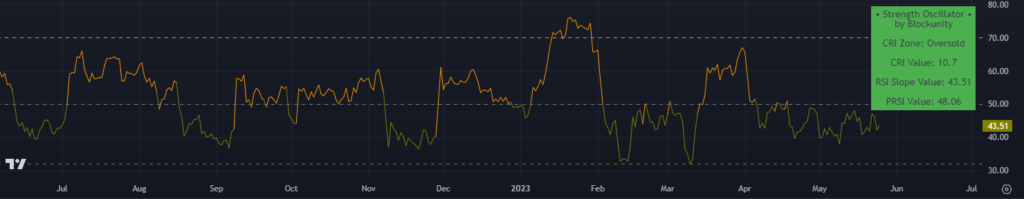
- By default, it also shows the RSI Slope, which evolves between the 32 and 70 bounds. It gives a signal when it leaves and re-enters its limits.
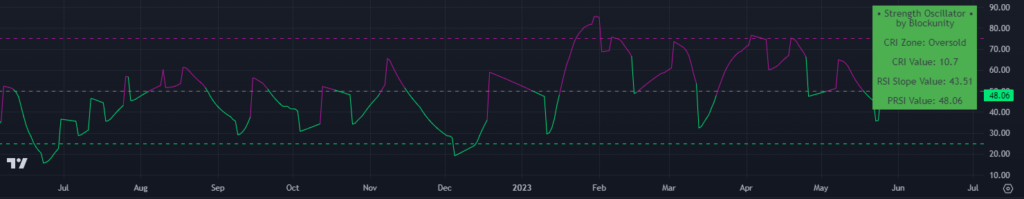
- It is even possible to display the Parabolic RSI (PRSI), which also triggers signals when it re-enters its bounds.
- Finally, it is also possible to display a Volatility-Adjusted RSI (VRSI). This does not for the moment give any signals on the chart.
Settings #
By opening the parameters of the indicator, it is possible to:
- Choose the preset mode via the “Preset Selector”:
- Conservative gives only the strongest signals, but may miss some.
- Hybrid is the default mode, and generally gives the best-balanced signals.
- Aggressive mode gives more signals, but increases the risk of false ones.
- Set the period to be taken into account when calculating the BSR. Default is 5.
- Activate or not the CRI Filter, to display only signals that match the overbought or oversold state of the CRI.
- Display or not BSR lines.
- Display or not the signals of the various embedded indicators.
- Customize parameters for all embedded indicators.
- Choose the position of the information panel.
Panel information #
The graph panel displays the following information:
- The mode according to the selected preset.
- BSR signal: Buy / Neutral / Sell.
- BSR state: Overbuy / Neutral / Oversold.
The panel color varies according to the BSR status.
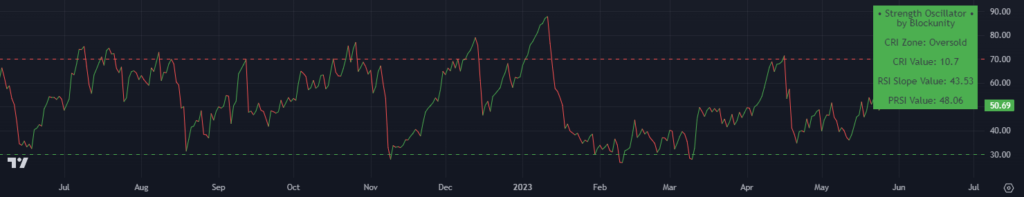
The oscillator panel shows:
- The zone in which the CRI is currently located: Overbuy / Neutral / Oversold.
- Live CRI value.
- Live value of RSI Slope.
- Live PRSI value.
Panel color varies according to CRI zone.
Indicator link #
Part 1 (Bands and Signals): https://www.tradingview.com/script/ybycr5tF-Blockunity-Strength-Reversion-BSR/
Part 2 (Oscillator): https://www.tradingview.com/script/adQSBYEh-Blockunity-Strength-Oscillator-BSO/
Please click on the Boost button of our indicators!
And don’t forget to follow us on TradingView so you don’t miss any updates: https://www.tradingview.com/u/Blockunity/