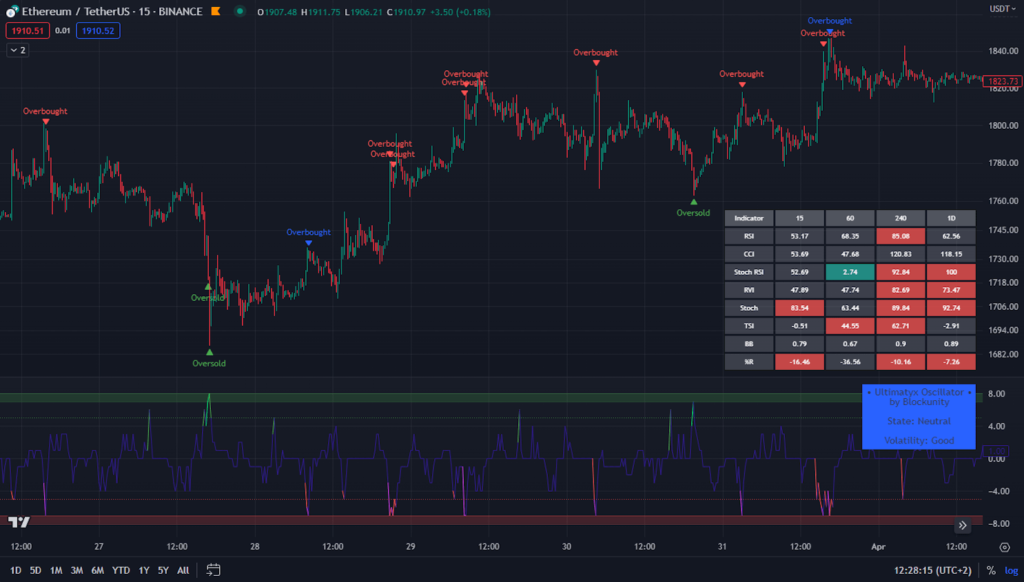
The goal of this indicator is to give you an overview of the status of many indicators on different timeframes. It consists of a Screener and an Oscillator. The oscillator allows you to detect correlations between the indicators included in the Screener in order to give buy and sell points.
Usage advice #
There are no specific guidelines for this indicator. It works on all time units and all assets. We still recommend that you use your chart in logarithmic.
The different elements and signals – The Screener #
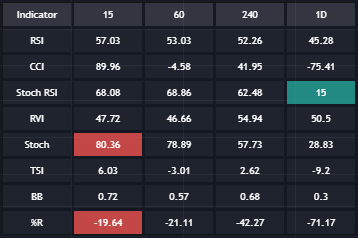
On your chart, you can find the Screener. It indicates the values of the following indicators:
- RSI (Relative Strength Index).
- CCI (Commodity Channel Index).
- Stoch RSI (Stochastic RSI).
- RVI (Relative Vigor Index).
- Stoch (Stochastic).
- TSI (True Strength Index).
- BB% (Bollinger Bands %B).
- %R (Williams Percent Range).
The background of each cell changes color if the indicator is oversold (green) or overbought (red).
In addition, it allows you to visualize all these values directly on several time units:
- Unit of the chart/the one you select.
- 1h.
- 4h.
- Daily.
It is possible to change the time unit of the columns 1h, 4h, and Daily in the parameters. The first time unit column is dynamic and linked to the one you choose for your chart.
In addition, you will find directly on the chart the buy and sell points. By default, we display the “Ultimatyx” signals, which are a correlation of the different indicators present in the Screener. Of course, you are able to display the signals of your choice by modifying it in the “Style” tab of the indicator parameters.
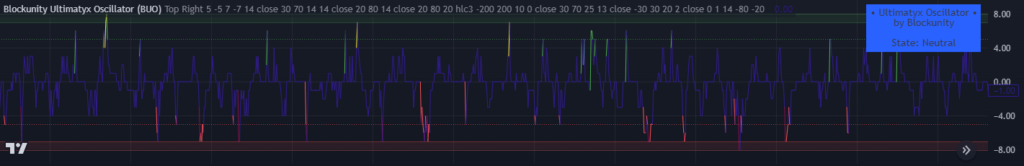
The different elements and signals – The Oscillator #
The oscillator allows you to identify the moments of correlation between the different indicators of the Screener. Its color varies according to the number of indicators returning the same signal. These thresholds are configurable. The color code is as follows:
- Yellow: Heavily Oversold.
- Green: Oversold.
- Purple: Neutral.
- Red: Overbuy.
- Dark pink: Heavily Overbuy.
This is the oscillator that triggers the “Ultimatyx” signals.
Settings #
By opening the parameters of the indicator, it is possible to :
- Modify the buy and sell zones for the “Ultimatyx” signals.
- Choose the different timeframes of the Screener.
- Configure the width of the Screener columns.
- Choose the Screener position.
- Customize the oversold and overbought colors.
- Customize the display colors of the Screener.
- Choose the indicators to display in the Screener.
- Choose the time units to be displayed in the Screener.
- Customize the parameters for all the indicators integrated in the Screener.
In the “Style” tab of the Screener settings, you can change the signals to be displayed on the chart.
In the “Style” tab of the oscillator parameters, you can also change the signals to be displayed, in order to visualize independently the signals returned by each indicator.
Panel information #
The oscillator panel gives the following information:
- State: Heavily Oversold / Oversold / Neutral / Overbuy / Heavily Overbuy
- Volatility: Good / Too High. If volatility is considered too high, the signals returned on the graph will appear in blue. In this case, you need to be more cautious in interpreting them, because when volatility is too high, overbought and oversold signals may be given a bit early.
The color of the panel varies according to the value of the oscillator.
Indicator link #
Part 1 (Screener): https://www.tradingview.com/script/P7o05OAs-Blockunity-Ultimatyx-Screener-BUS/
Part 2 (Oscillator): https://www.tradingview.com/script/ij8uEouM-Blockunity-Ultimatyx-Oscillator-BUO/
Please click on the Boost button of our indicators!
And don’t forget to follow us on TradingView so you don’t miss any updates: https://www.tradingview.com/u/Blockunity/