
Unleash the power of multiple Unyx Data in a single indicator. Thanks to the Unyx Data Overview, you’ll be able to retrieve a wealth of information and status from other metrics in a unified table. It displays data from 5 assets in addition to the one selected on your chart, and these assets can be customized in the indicator’s parameters. Moreover, the BUD gives correlation signals between the various Unyx Data, directly on your graph to detect points of interest.
Usage advice #
This indicator is best used in TradingView’s Dark mode. If you don’t want to display the BUD signals, you can place the table in a pane below the graph for better visualization. Otherwise, there’s nothing special about the use of this indicator. We still recommend that you use your logarithmic chart for a better visualization, but this is optional.
The different elements #
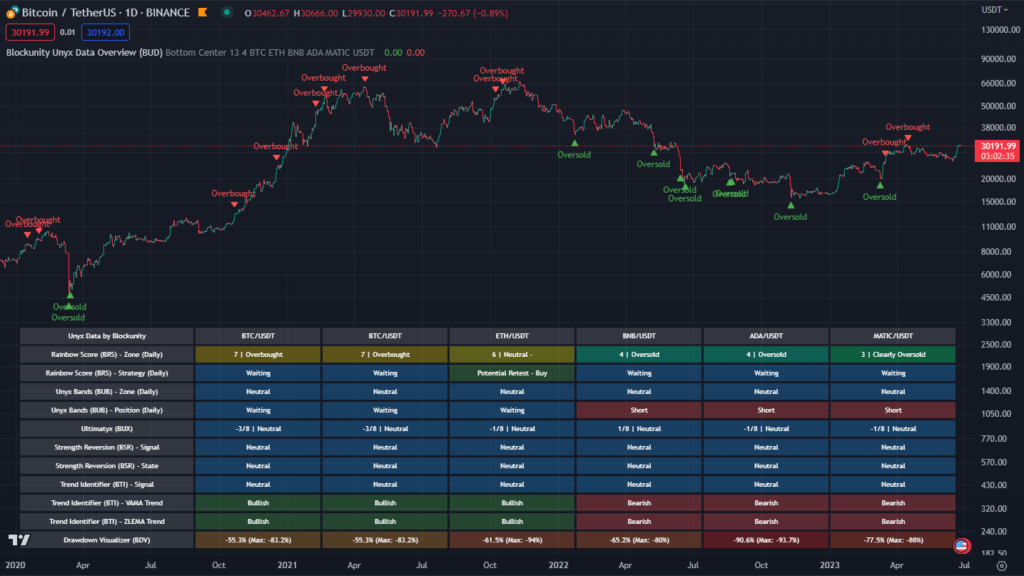
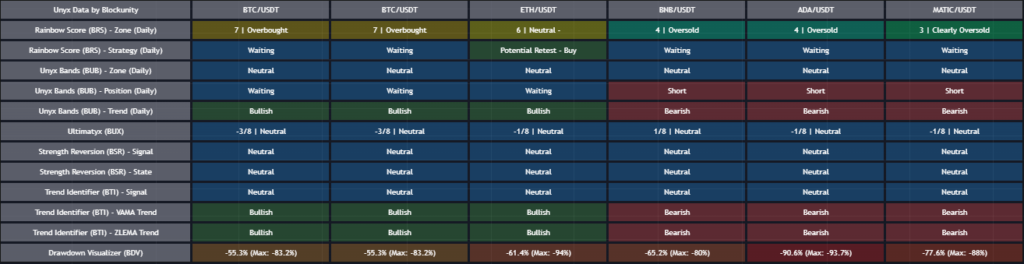
The BUD is made up of a single element: a highly complete table, bringing together up to 12 pieces of information from 6 different Unyx Data! All this on 6 assets at the same time (configurable in the parameters). All metrics adapt to the selected timeframe, except for the Rainbow Score and Unyx Bands indicators, which are always in Daily. The colors of the table cells vary according to the status of the various data. Various texts that may appear in the table cells are always self-explanatory.
The different signals #
BUD also integrates correlation signals between the various data included in the table. These signals can be deactivated in the indicator parameters. You can also set the trigger threshold: the higher the threshold, the more rare and filtered the signals will be; the lower the threshold, the more numerous but less relevant the signals will be.
Settings #
By opening the parameters of the indicator, it is possible to :
- Choose the position of the table.
- Modify table column width.
- Change the color of table header cells.
- Activate or deactivate the display of signals on the graph.
- Set the trigger level for BUD signals.
- Set the 5 assets you wish to see by default in the table.
- Configure the pair of the 5 assets in the table.
- Display or not the different data lines of the table.
Indicator link #
https://www.tradingview.com/script/noSF5Oxc-Blockunity-Unyx-Data-Overview-BUD/
Please click on the Boost button of our indicators!
And don’t forget to follow us on TradingView so you don’t miss any updates: https://www.tradingview.com/u/Blockunity/