

Create your own personalized strategies with our ultra-complete Strategy Builder in order to obtain your unique combination, which perfectly suits your desires.
Find +35 indicators and +80 strategies with adjustable parameters.
General #
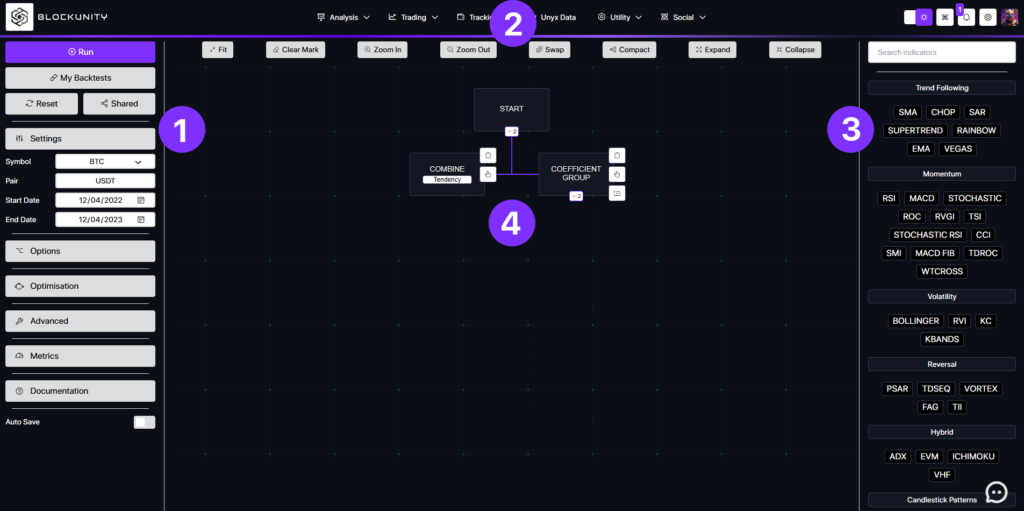
1. Left section
- Run: Start the calculation of your defined strategy.
- My Backtests: Visualize and load your backtest history.
- Reset: Reset the builder and the parameters.
- Shared: Find the strategies shared by the community.
- Settings: Define the global parameters and your time range.
- Options: Choose your basic parameters such as stop loss or take profit.
- Optimisation: Choose your optimisation parameters to display.
- Advanced: Choose advanced parameters such as buy and sell coefficients.
- Metrics: Choose the statistics and financial ratios to display.
- Auto Save : Save your actual strategy.
An information icon is also present for each item to guide you in your selection.
2. Top section (apply on the section 4)
- Fit: Adapt the flowchart to your screen.
- Clear Mark: Delete the selected block path.
- Zoom In / Zoom Out: Zoom in and zoom out.
- Swap: Orient your flowchart along different axes.
- Compact: Group or space the blocks.
- Expand: View/unfold all of the blocks and parameters of the strategy.
- Collapse: Hide/minimize all of the blocks and parameters of the strategy.
3. Right section
This section allows you to choose the indicator of your choice (RSI, MACD…), then to select one of our pre-defined strategies (volatility, cross…), and finally to add an optimization (overbuy, oversell) of some parameters.
An information icon is also present for each item to guide you in your selection.
4. Middle section
The addition of all these elements can overwhelm you, hence the importance of having visual support.
- View your selection here in the form of a “family tree” for clarity.
- Use the features shown (2) to adapt the flowchart to your preferences.
- Modify directly the parameters and elements of your strategy.
Indicators Definition #
| Symbol | Name | Definition |
|---|---|---|
| ADX | Average Directional Movement | Help measuring the overall strength of a trend. The ADX indicator is an average of expanding price range values. |
| BOLLINGER | Bollinger Bands | The purpose of Bollinger Bands is to provide a relative definition of high and low prices of a market. By definition, prices are high at the upper band and low at the lower band. |
| CCI | Commodity Channel Index | Measures the difference between the current price and the historical average price. |
| CFI | Commodity Force Index | Illustrate how strong the actual buying or selling pressure is. It combines price direction, extent, and volume to determine price movement. |
| CHOP | Choppiness | Helps determine whether the market is choppy (trading sideways) or not choppy (trading within a trend in either direction). It shows how long an individual segment of the market outperforms the market in general. |
| DIVERGENCE | Divergence | Divergence between indicator and price, can be coupled on all indicators except SMI (internal process). |
| EMA | Exponential Moving Average | Similar to Simple Moving Average (SMA), measuring trend direction over a period of time. However, whereas SMA simply calculates an average of price data, EMA applies more weight to data that is more current. |
| EVM | Ease of Movement | Volume-based oscillator that fluctuates above and below the zero line. |
| FAG | Fear & Greed | Measure the greed and fear of investors in the market. |
| ICHIMOKU | Ichimoku Kinkō Hyō | Technical indicator that is used to gauge momentum along with future areas of support and resistance. |
| KBANDS | KBands | Indicator that specifically takes into account the maximum volatility for a given reference period. |
| KC | Keltner Channel | Technical indicator that is often used by traders to identify volatility and the direction of the market. |
| MACD | Moving Average Convergence Divergence | This indicator is used to understand the momentum and its directional strength by calculating the difference between two time period intervals. |
| MACD FIB | MACD with Fibonacci | MACD indicators combined with a Fibonacci Moving Average. |
| PSAR | Parabolic Stop And Reverse | Trailing stop-based trading system that is often used as an indicator as well. The SAR uses a trailing stop level that follows prices as they move up or down. |
| RAINBOW | Rainbow | Mix between a trend-following and a contrarian system. It’s a combination of smoothed moving averages that are used together to confirm a beginning or end of a trend. |
| ROC | Rate Of Change | Momentum-based technical indicator that measures the percentage change in price between the current price and the price a certain number of periods ago. |
| RSI | Relative Strength Index | Momentum indicator that measures the magnitude of recent price changes to analyze overbought or oversold conditions. |
| RVGI | Relative Vigor Index | Oscillator based on the concept that prices tend to close higher than they open in up trends and close lower than they open in down trends. |
| RVI | Relative Volatility Index | Is similar to the Relative Strength Index (RSI) index. Both measure the direction of volatility, but RVI uses the standard deviation of price changes in its calculations, while RSI uses the absolute price changes. |
| SAR | Stop And Reverse | Used to determine the price direction of an asset, as well as draw attention to when the price direction is changing |
| SMA | Simple Moving Average | Measures the direction of the trend over a period of time by averaging price data. |
| SMI | Squeeze Momentum Index | A derivative of John Carter’s “TTM Squeeze” volatility indicator, made by LazyBear, combining Bollinger Bands and Keltner Channel. |
| STOCHASTIC | Stochastic | Momentum indicator that shows the location of the close relative to the high-low range over a set number of periods. |
| STOCHASTIC RSI | Stochastic RSI | Ranges between zero and 100 and is created by applying the Stochastic oscillator formula to a set of Relative Strength Index (RSI) values rather than to standard price data. |
| SUPERTREND | Supertrend | Trend following indicator similar to moving averages. It is plotted on the price and the current trend can simply be determined by its position relative to the price. |
| TDROC | Tom DeMark Rate Of Change | A revised version by Tom Demark of the Rate Of Change indicator. |
| TDSEQ | Tom DeMark Sequential | Powerful tool designed to identify the exact time of trend exhaustion and price reversal. |
| TII | Trend Intensity Index | Is a measure of the strength of the trend, created by a 10-period moving average and price deviations around it, then, we will count the number of the up periods relative to the total number of periods. |
| TSI | True Strength Index | Momentum oscillator used in technical analysis to determine the strength and momentum of a market’s trend. |
| VEGAS | Vegas Cloud | Trend following indicator forming a cloud created with two moving averages. |
| VHF | Vertical Horizontal Filter | This trend following indicator determines whether prices are in a trending phase or a congestion phase. |
| VORTEX | Vortex | Is used to spot trend reversals and confirm current trends using a pair of oscillating lines. |
| WTCROSS | WaveTrend Crosses | Trend indicator that draws waves with highs and lows between two values. |
You can add these parameters to combine indicators :
| Name | Definition |
|---|---|
| Coefficient | Correlation method based on a coefficient giving more or less weight to the different selected strategies. The total coefficient must be equal to 1. The higher the coefficient, the more weight the concerned strategy will have in the given global signal. Example: By correlating the RSI (with a coefficient of 0.7) and the MACD (with a coefficient of 0.3), the RSI will have more weight in the signal given by the global strategy than the MACD. |
| Coefficient Group | Module for assigning coefficients to groups of indicators. Only useful when the combination method is set to “Coefficient”. The total coefficient must be equal to 1. |
| Combine | Module allowing to select the type of correlation of indicators and strategies. |
| Priority | Correlation method based on the priority given to the indicator. The smaller the number is, the higher the priority. Example: By correlating the RSI (with a priority of 1) and MACD (with a priority of 2), if the RSI gives a sell signal and the MACD a buy signal, the signal sent by the strategy will be sell. |
| Tendency | Correlation method based on a majority of signals to give a strong global signal. Example: By correlating 3 indicators, if two give a buy signal, then the global signal will be buy. If only one is buy and the other two are neutral, then the global signal will be neutral. |
| Unanimous | Correlation method where all the selected strategies must send the same type of signal for a global signal to be sent. Example: By correlating the RSI and the MACD, if the RSI gives a buy signal and the MACD is neutral, the signal given by the global strategy will be neutral. If the RSI gives a sell signal and the MACD also gives a sell signal, the signal given by the global strategy will be sell. |
Strategies Definition #
| Related Indicator | Name | Schema | Definition |
|---|---|---|---|
| ADX | Divergence | 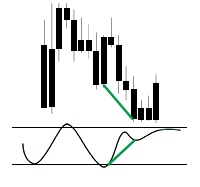 | Gives a buy signal if a bullish divergence is detected. Gives a sell signal if a bearish divergence is detected. |
| ADX | Cross |  | Gives a buy or sell signal depending on the direction of the crossings of the ADX lines. |
| BOLLINGER | Distance Reversal |  | Gives a signal if the price just went below or above the Bollinger Bands, and if the distance multiplied by the previous distance is lower than 0. |
| BOLLINGER | Reversal |  | Gives a signal if the price just went below or above the Bollinger Bands. |
| CCI | Volatility |  | Gives a signal if the previous value just went below or above the indicated limits. |
| CCI | Volatility Zone |  | Takes into account all the values that are below/above the indicated borders. |
| CFI | Volatility | | Gives a signal if the previous value just went below or above the indicated limits. |
| CFI | Volatility Zone | | Takes into account all the values that are below/above the indicated borders. |
| CHOP | Volatility | | Gives a signal when the value of the indicator was out of its limits and returns to the inside. |
| CHOP | Volatility Zone | | Takes into account all the values that are below/above the indicated borders. |
| CHOP | Volatility Reversed |  | Gives a signal if the previous value just went below or above the indicated limits. |
| EMA | Cross | | Gives a buy signal if the short moving average crosses the long moving average from below. Gives a sell signal if the short moving average crosses the long moving average from above. |
| EVM | Volatility | | Gives a signal when the value of the indicator was out of its limits and returns to the inside. |
| EVM | Volatility Zone | | Takes into account all the values that are below/above the indicated borders. |
| EVM | Volatility Reversed | | Gives a signal if the previous value just went below or above the indicated limits. |
| FAG | Volatility | | Gives a signal when the value of the indicator was out of its limits and returns to the inside. The FAG is created for Bitcoin, however it can also work for other highly correlated assets. |
| FAG | Volatility Zone | | Takes into account all the values that are below/above the indicated borders. The FAG is created for Bitcoin, however it can also work for other highly correlated assets. |
| FAG | Volatility Reversed | | Gives a signal if the previous value just went below or above the indicated limits. The FAG is created for Bitcoin, however it can also work for other highly correlated assets. |
| FAG | Cross | | Gives a buy or sell signal depending on the direction of the FAG signal lines crossings. The FAG is created for Bitcoin, however it can also work for other highly correlated assets. |
| ICHIMOKU | Cross Part | 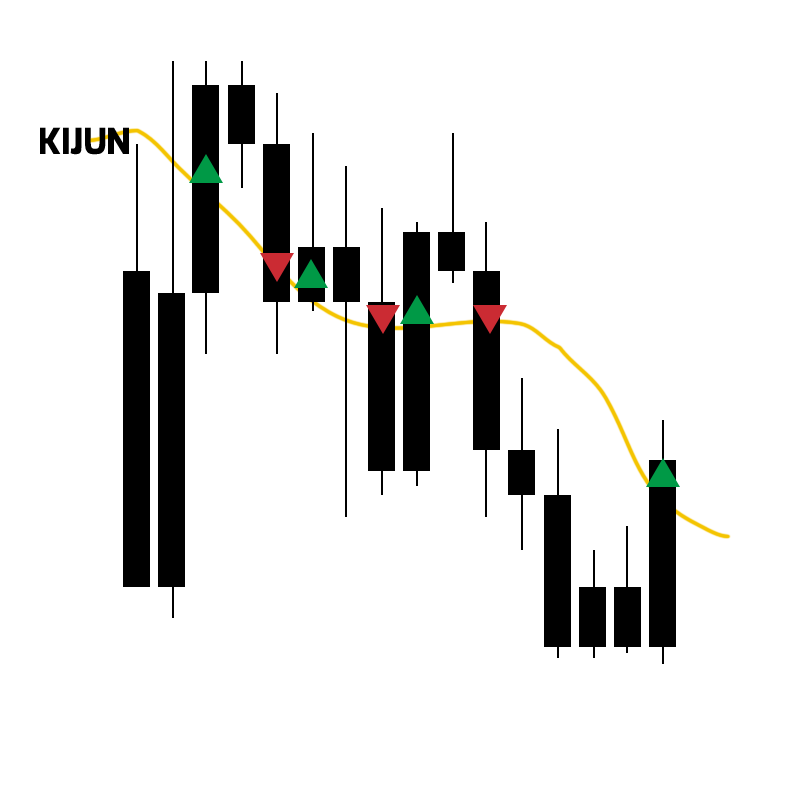 | Gives a buy signal if the price crosses the Tenkan/Kijun from below. Gives a sell signal if the price crosses the Tenkan/Kijun from above. |
| ICHIMOKU | Cross Senkou |  | Gives a buy signal if the cloud turns green (SSA > SSB). Gives a sell signal if the cloud turns red (SSB > SSA). |
| ICHIMOKU | Cross Mixed | 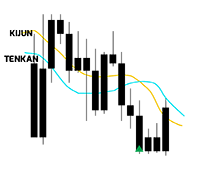 | Gives a buy signal if the Tenkan crosses the Kijun from below. Gives a sell signal if the Tenkan crosses the Kijun from above. |
| ICHIMOKU | Above Cloud | 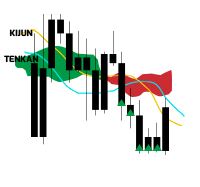 | Gives a buy signal if the price closes under the cloud, the Tenkan and the Kijun. Or gives a buy signal if the Tenkan crosses the Kijun from above and the price is above the cloud. Gives a sell signal if the price closes above the cloud, the Tenkan and the Kijun. Or gives a sell signal if the Tenkan crosses the Kijun from below and the price is below the cloud. |
| ICHIMOKU | In Cloud | 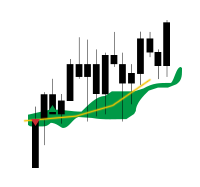 | Gives a buy signal if the price goes into the Cloud from the upside. Gives a sell signal if the price goes into the Cloud from the downside. |
| ICHIMOKU | Break Cloud | 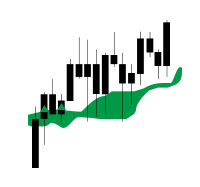 | Gives a buy signal if the price exits the Cloud from the upside. Gives a sell signal if the price exits the Cloud from the downside. |
| ICHIMOKU | Chikou Break Cloud | 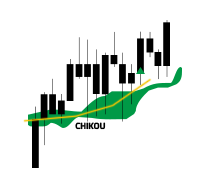 | Gives a buy signal if the Chikou (Lagging Span) breaks the cloud to the upside. Gives a sell signal if the Chikou (Lagging Span) breaks the cloud on the downside. |
| ICHIMOKU | Above Cloud 2 | 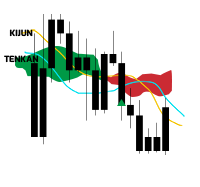 | Same as Ichimoku – above_cloud strategy, but the price has to cross Tenkan. |
| ICHIMOKU | Score | | Gives a signal when the value of the indicator was out of its limits and returns to the inside. This strategy is based on an in-house developed Ichimoku oscillator. |
| ICHIMOKU | Score Reversed | | Gives a signal if the previous value just went below or above the indicated limits. This strategy is based on an in-house developed Ichimoku oscillator. |
| KBANDS | Reversal | | Gives a signal if the previous value just went below or above the indicator limits. |
| KC | Reversal | | Gives a buy signal if the price is below the low border of the KC and the low point of the candle is higher than the previous one. Gives a sell signal if the price is above the high border of the KC and the high point of the candle is lower than the previous one. |
| MACD | Signal MACD | 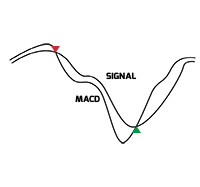 | Gives a buy signal if the MACD line crosses the Signal line from below. Gives a sell signal if the MACD line crosses the Signal line from above. |
| MACD FIB | Reversal | 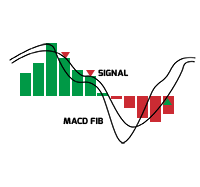 | Gives a buy signal if Signal is less than or equal to HIST, and the previous day’s signal is greater than the previous day’s HIST, and the previous day’s HIST is greater than the MACD_FIB. Inversely to give a sell signal. |
| PSAR | Reversal | 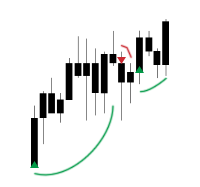 | Gives a buy signal if the price rises above the indicator’s level from below. Gives a sell signal if the price goes below the level of the indicator from above. |
| RAINBOW | Volatility | | Gives a signal when the value of the indicator was out of its limits and returns to the inside. |
| RAINBOW | Volatility Zone | | Takes into account all the values that are below/above the indicated borders. |
| RAINBOW | Volatility Reversed | | Gives a signal if the previous value just went below or above the indicated limits. |
| RAINBOW | Cross | | Gives a buy signal if the price exits the Rainbow from the upside. Gives a sell signal if the price exits the Rainbow from the downside. |
| ROC | Volatility | | Gives a signal when the value of the indicator was out of its limits and returns to the inside. |
| ROC | Volatility Reversed | | Gives a signal if the previous value just went below or above the indicated limits. |
| ROC | Volatility Zone | | Takes into account all the values that are below/above the indicated borders. |
| RSI | Neutral Zone | 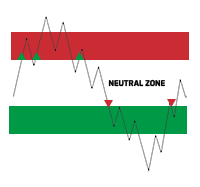 | Gives a buy signal if the RSI exits its neutral zone from above. Gives a sell signal if the RSI exits its neutral zone from below. |
| RSI | Volatility | | Gives a signal when the value of the indicator was out of its limits and returns to the inside. |
| RSI | Volatility Reversed | | Gives a signal if the previous value just went below or above the indicated limits. |
| RSI | Divergence | | Gives a buy signal if a bullish divergence is detected. Gives a sell signal if a bearish divergence is detected. |
| RSI | Volatility Zone | | Takes into account all the values that are below/above the indicated borders. |
| RSI | Cross | 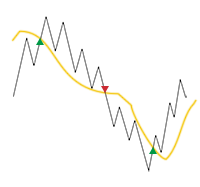 | Gives a buy signal if the RSI crosses the RSI_SIGNAL line from below. Gives a sell signal if the RSI crosses the RSI_SIGNAL line from above. |
| RVGI | Volatility | | Gives a signal when the value of the indicator was out of its limits and returns to the inside. |
| RVGI | Volatility Zone | | Takes into account all the values that are below/above the indicated borders. |
| RVGI | Cross | | Gives a buy signal if the RVGI line crosses the RVGI_SIGNAL line from below. Gives a sell signal if the RVGI line crosses the RVGI_SIGNAL line from above. |
| RVGI | Volatility Reversed | | Gives a signal if the previous value just went below or above the indicated limits. |
| RVI | Cross | | Gives a buy signal if the RVI crosses its moving average from below. Gives a sell signal if the RVI crosses its moving average from above. |
| RVI | Volatility Zone | | Takes into account all the values that are below/above the indicated borders. |
| RVI | Volatility | | Gives a signal when the value of the indicator was out of its limits and returns to the inside. |
| RVI | Volatility Reversed | | Gives a signal if the previous value just went below or above the indicated limits. |
| RVI | Neutral Zone | | Gives a buy signal if the RVI exits its neutral zone from above. Gives a sell signal if the RVI exits its neutral zone from below. |
| SAR | Volatility | | Gives a signal when the value of the indicator was out of its limits and returns to the inside. |
| SAR | Volatility Zone | | Takes into account all the values that are below/above the indicated borders. |
| SAR | Volatility Reversed | | Gives a signal if the previous value just went below or above the indicated limits. |
| SMA | Cross | | Gives a buy signal if the short moving average crosses the long moving average from below. Gives a sell signal if the short moving average crosses the long moving average from above. |
| SMI | Increase | 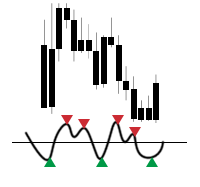 | Gives a buy signal if the bearish momentum (red) starts to decrease. Gives a sell signal if the bullish momentum (green) starts to decrease. |
| SMI | Increase Zone | 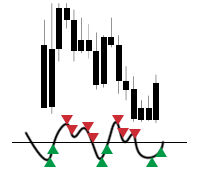 | Gives a buy signal every time the downward momentum (red) decreases. Gives a sell signal every time the upward momentum (green) decreases. |
| SMI | Squeeze Released | 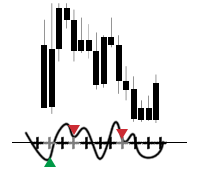 | Gives a buy signal if the dot mark changes from black to grey and the momentum is bearish. Gives a sell signal if the dot mark changes from black to gray and the momentum is bullish. |
| SMI | Divergence | | Gives a buy signal if a bullish divergence is detected. Gives a sell signal if a bearish divergence is detected. |
| STOCHASTIC | Cross | | Gives a buy signal if the K line crosses the D line from below. Gives a sell signal if the K line crosses the D line from above. |
| STOCHASTIC RSI | Cross | | Gives a buy signal if the S_RSI_K line crosses the S_RSI_D line from below. Gives a sell signal if the S_RSI_K line crosses the S_RSI_D line from above. |
| SUPERTREND | Cross |  | Gives a buy signal if the price rises above the indicator’s level from below. Gives a sell signal if the price goes below the level of the indicator from above. |
| TDROC | Volatility | | Gives a signal when the value of the indicator was out of its limits and returns to the inside. |
| TDROC | Volatility Reversed | | Gives a signal if the previous value just went below or above the indicated limits. |
| TDROC | Volatility Zone | | Takes into account all the values that are below/above the indicated borders. |
| TDSEQ | Signal |  | Gives a buy or sell signal depending on the sequence of the previous candles. |
| TII | Volatility | | Gives a signal when the value of the indicator was out of its limits and returns to the inside. |
| TII | Volatility Zone | | Takes into account all the values that are below/above the indicated borders. |
| TII | Volatility Reversed | | Gives a signal if the previous value just went below or above the indicated limits. |
| TII | Cross | | Gives a buy signal if the indicator crosses its signal line from below. Gives a sell signal if the indicator crosses its signal line from above. |
| TSI | Cross | | Gives a buy signal if the TSI line crosses the TSI_SIGNAL line from below. Gives a sell signal if the TSI line crosses the TSI_SIGNAL line from above. |
| VEGAS | cross | 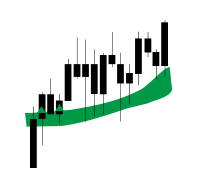 | Gives a buy signal if the price exits the Vegas cloud from the upside. Gives a sell signal if the price exits the Vegas cloud from the downside. |
| VHF | Volatility | | Gives a signal when the value of the indicator was out of its limits and returns to the inside. |
| VHF | Volatility Zone | | Takes into account all the values that are below/above the indicated borders. |
| VHF | Volatility Reversed | | Gives a signal if the previous value just went below or above the indicated limits. |
| VHF | Cross | | Gives a buy signal if the indicator crosses its signal line from below. Gives a sell signal if the indicator crosses its signal line from above. |
| VORTEX | Cross | | Gives a buy or sell signal depending on the direction of the crossings of the Vortex lines. |
| WTCROSS | Cross | | Gives a buy signal if the WT1 line crosses the WT2 line from below. Gives a sell signal if the WT1 line crosses the WT2 line from above. |
Indicators Parameters Definition #
| Related Indicator | Name | Description |
|---|---|---|
| ADX | Window | Specifies the number of periods to be taken into account in the calculation of the indicator. |
| BOLLINGER | Sma | Specifies the number of periods to be taken into account in the calculation of the Bollinger Bands indicator. |
| BOLLINGER | Dev | Specifies the standard deviation which measures the amount of variation or dispersion. |
| CCI | Window | Specifies the number of periods to be taken into account in the calculation of the indicator. |
| CFI | Window | Specifies the number of periods to be taken into account in the calculation of the indicator. |
| CHOP | Window | Specifies the number of periods to be taken into account in the calculation of the indicator. |
| CHOP | Atr Loopback | Specifies the value of the Average True Range which measures the volatility. |
| CHOP | Scalar | CHOP specific scaling parameter. |
| EMA | Ema S | Specifies the number of periods to be taken into account in the calculation of the fast signal line. |
| EMA | Ema L | Specifies the number of periods to be taken into account in the calculation of the slow signal line. |
| EVM | Window | Specifies the number of periods to be taken into account in the calculation of the indicator. |
| EVM | Scalar | EVM specific scaling parameter. |
| FAG | S One Window | Specifies the number of periods to be taken into account in the calculation of the fast signal line. |
| FAG | S Two Window | Specifies the number of periods to be taken into account in the calculation of the slow signal line. |
| ICHIMOKU | Tenkan Period | Specifies the number of periods to be taken into account in the calculation of the conversion line (Tenkan). |
| ICHIMOKU | Kijun Period | Specifies the number of periods to be taken into account in the calculation of the baseline (Kijun). |
| ICHIMOKU | Senkou Span Period | Specifies the number of periods to be taken into account in the calculation of the Lagging Span (Senkou). |
| ICHIMOKU | Score Period | Specifies the number of periods to be taken into account in the calculation of the score. |
| KBANDS | Window | Specifies the number of periods to be taken into account in the calculation of the indicator. |
| KBANDS | Dev | Specifies the multiple of the Average True Range (ATR). |
| KC | Sma | Specifies the number of periods to be taken into account in the calculation of the Keltner Channel indicator. |
| KC | Dev | Specifies the value of the Average True Range which measures the volatility. |
| KC | Atr Loopback | The Average True Range measures the volatility. |
| MACD | Signal Mw | MACD calculation is further smoothed to provide a signal line. |
| MACD | Ema S | Specifies the number of periods to be taken into account in the calculation of the fast signal line. |
| MACD | Ema L | Specifies the number of periods to be taken into account in the calculation of the slow signal line. |
| MACD FIB | Ema S | Specifies the number of periods to be taken into account in the calculation of the fast signal line. |
| MACD FIB | Ema L | Specifies the number of periods to be taken into account in the calculation of the slow signal line. |
| MACD FIB | Signal Mw | MACD calculation is further smoothed to provide a signal line. |
| PSAR | Af | The Starting Step of the Acceleration Factor. |
| PSAR | Amax | The Maximum Step of the Acceleration Factor. |
| PSAR | Af Increase | The increase of the Acceleration Factor. |
| ROC | Delta | Specifies the number of periods to be taken into account in the calculation of the indicator. |
| RSI | Window | Specifies the number of periods to be taken into account in the calculation of the indicator. |
| RVGI | Window | Specifies the number of periods to be taken into account in the calculation of the indicator. |
| RVI | Std Period | Specifies the standard deviation of the closing prices. |
| RVI | Sma Period | Specifies the number of periods to be taken into account in the MA calculation of the indicator. |
| SAR | Window | Specifies the number of periods to be taken into account in the calculation of the indicator. |
| SAR | Af | The Starting Step of the Acceleration Factor. |
| SAR | Amax | The Maximum Step of the Acceleration Factor. |
| SMA | Sma S | Specifies the number of periods to be taken into account in the calculation of the fast signal line. |
| SMA | Sma L | Specifies the number of periods to be taken into account in the calculation of the slow signal line. |
| SMI | Bollinger Sma | Specifies the number of periods to be taken into account in the calculation of the Bollinger Bands indicator. |
| SMI | Bollinger Dev | Specifies the Bollinger Bands standard deviation which measures the amount of variation or dispersion. |
| SMI | Kc Sma | Specifies the number of periods to be taken into account in the calculation of the Keltner Channel indicator. |
| SMI | Kc Dev | Specifies the value of the Average True Range which measures the volatility of the Keltner Channel indicator. |
| SMI | Atr Loopback | The length of the Average True Range which measures the volatility. |
| SMI | Mom Window | Specifies the number of periods to be taken into account in the calculation of the SMI indicator. |
| SMI | Mom Div Order | SMI specific divergence parameter. |
| SMI | Mom Div K | SMI specific divergence parameter. |
| STOCHASTIC | Window | Specifies the number of periods to be taken into account in the calculation of the indicator. |
| STOCHASTIC | MovingAverage | Specifies the value of the Moving Average (MA). |
| STOCHASTIC RSI | Window | Specifies the number of periods to be taken into account in the calculation of the Stochastic indicator. |
| STOCHASTIC RSI | Rsi Window | Specifies the number of periods to be taken into account in the calculation of the RSI indicator. |
| STOCHASTIC RSI | MovingAverageK | Specifies the number of periods to be taken into account in the calculation of the K line. |
| STOCHASTIC RSI | MovingAverageD | Specifies the number of periods to be taken into account in the calculation of the D line. |
| SUPERTREND | Window | Specifies the number of periods to be taken into account in the calculation of the indicator. |
| SUPERTREND | Band Multiplier | Specifies the multiple of the ATR. |
| TDROC | Delta | Specifies the number of periods to be taken into account in the calculation of the indicator. |
| TDSEQ | Td Drift | Specifies the number of periods to be taken into account in the calculation of the TD Sequential. |
| TII | Window | Specifies the number of periods to be taken into account in the calculation of the slow signal line. |
| TII | Window Signal | Specifies the number of periods to be taken into account in the calculation of the fast signal line. |
| TSI | Smooth P S | Specifies the number of periods to be taken into account in the calculation of the slow signal line. |
| TSI | Smooth P SS | Specifies the number of periods to be taken into account in the calculation of the fast signal line. |
| VEGAS | Ema S | Specifies the number of periods to be taken into account in the calculation of the fast signal line. |
| VEGAS | Ema L | Specifies the number of periods to be taken into account in the calculation of the slow signal line. |
| VHF | Window | Specifies the number of periods to be taken into account in the calculation of the indicator. |
| VHF | Signal | Specifies the number of periods to be taken into account in the calculation of the signal line. |
| VHF | Drift | Drift parameter specific to VHF. |
| VORTEX | Window | Specifies the number of periods to be taken into account in the calculation of the indicator. |
| VORTEX | Prev Day | Specifies the value of the Vortex Indicator horizontal line. |
| WTCROSS | Average Window | Number of candles used to average WaveTrend. |
| WTCROSS | Channel Window | Number of candles used to calculate WaveTrend. |
Strategies Parameters Definition #
| Related Indicator | Name | Definition |
|---|---|---|
| ADX | Trend Strength | Specifies the strength of the signal being necessary to consider it as valid. |
| CCI | Buy Border | Specifies the level at which buy signals will be triggered. |
| CCI | Sell Border | Specifies the level at which sell signals will be triggered. |
| CFI | Buy Border | Specifies the level at which buy signals will be triggered. |
| CFI | Sell Border | Specifies the level at which sell signals will be triggered. |
| CHOP | Sell Border | Specifies the level at which sell signals will be triggered. |
| CHOP | Buy Border | Specifies the level at which buy signals will be triggered. |
| EVM | Sell Border | Specifies the level at which sell signals will be triggered. |
| EVM | Buy Border | Specifies the level at which buy signals will be triggered. |
| FAG | Sell Border | Specifies the level at which sell signals will be triggered. |
| FAG | Buy Border | Specifies the level at which buy signals will be triggered. |
| ICHIMOKU | Drift Shift | Specific drift parameter for this Ichimoku strategy. |
| ICHIMOKU | Sell Border | Specifies the level at which sell signals will be triggered. |
| ICHIMOKU | Buy Border | Specifies the level at which buy signals will be triggered. |
| RAINBOW | Sell Border | Specifies the level at which sell signals will be triggered. |
| RAINBOW | Buy Border | Specifies the level at which buy signals will be triggered. |
| RAINBOW | Cross Sma First | Specifies the number of periods to be taken into account in the calculation of the fast signal line. |
| RAINBOW | Cross Sma Second | Specifies the number of periods to be taken into account in the calculation of the slow signal line. |
| ROC | Buy Border | Specifies the level at which buy signals will be triggered. |
| ROC | Sell Border | Specifies the level at which sell signals will be triggered. |
| RSI | Neutral | Specifies the extent of the zone considered as neutral. Example: If Neutral Borders = 5, the neutral zone extends by default (see parameter Neutral Level) from 45 to 55 for the RSI. |
| RSI | Overbuy | Specifies the level at which the price is considered to be overbought. |
| RSI | Oversell | Specifies the level at which the price is considered oversold. |
| RSI | Neutral Init | Specifies the neutrality level of the RSI oscillator. Must be completed with the parameter Neutral Borders. |
| RVGI | Buy Border | Specifies the level at which buy signals will be triggered. |
| RVGI | Sell Border | Specifies the level at which sell signals will be triggered. |
| RVI | Sell Border | Specifies the level at which sell signals will be triggered. |
| RVI | Buy Border | Specifies the level at which buy signals will be triggered. |
| RVI | Neutral | Specifies the extent of the zone considered as neutral. Example: If Neutral Borders = 5, the neutral zone extends by default (see parameter Neutral Level) from 45 to 55 for the RVI. |
| RVI | Overbuy | Specifies the level at which the price is considered to be overbought. |
| RVI | Oversell | Specifies the level at which the price is considered oversold. |
| RVI | Neutral Init | Specifies the neutrality level of the RVI indicator. Must be completed with the parameter Neutral Borders. |
| SAR | Sell Border | Specifies the level at which sell signals will be triggered. |
| SAR | Buy Border | Specifies the level at which buy signals will be triggered. |
| STOCHASTIC RSI | Buy Border | Specifies the level at which buy signals will be triggered. |
| STOCHASTIC RSI | Sell Border | Specifies the level at which sell signals will be triggered. |
| TDROC | Buy Border | Specifies the level at which buy signals will be triggered. |
| TDROC | Sell Border | Specifies the level at which sell signals will be triggered. |
| TDSEQ | Signal Strength | Specifies the strength of the signal being necessary to consider it as valid. |
| TII | Sell Border | Specifies the level at which sell signals will be triggered. |
| TII | Buy Border | Specifies the level at which buy signals will be triggered. |
| TSI | Buy Border | Specifies the level at which buy signals will be triggered. |
| TSI | Sell Border | Specifies the level at which sell signals will be triggered. |
| WTCROSS | Buy Border | Specifies the level at which buy signals will be triggered. |
| WTCROSS | Sell Border | Specifies the level at which sell signals will be triggered. |
Backtesting Parameters #
| Name | Values | Default | Description |
|---|---|---|---|
| Coef Buy | 0 to 1 | 0.3 | Specifies the level at which buy signals will be triggered when combine type is set to Coefficient. |
| Coef Sell | 0 to -1 | -0.3 | Specifies the level at which sell signals will be triggered when combine type is set to Coefficient. |
| Long Only | True, False | False | Option to take only buy positions (Long order). |
| Max | Can be set as desired but min and max values depend on the selected setting. | Default depend on selected setting. | End value of the optimisation range. |
| Min | Can be set as desired but min and max values depend on the selected setting. | Default depend on selected setting. | Start value of the optimisation range. |
| Random Percent Brut | 0 to 1 | 0.3 | Defines the percentage of randomness injected into the optimization mechanism. The lower the value (tends to 0), the deeper but slower the optimisation will be. The higher the value (tends to 1), the more superficial but fast the optimisation will be. |
| Sell Only | True, False | False | Option to take only sell positions (Short order). |
| Sorted By | Sortino, Omega, Calmar, Max Drawdown, Sharpe, Return/Percent, Stability, Tail | omega | Choose according to which parameter the optimisation should be done. |
| Step | Can be set as desired. | Default depend on selected setting. | Step between the start and end of the optimisation range. |
| Stop Loss | 0.01 to 0.99 | A protective order to close a position before it causes too much loss. Set in percentages (%). | |
| Take Profit | -0.01 to -0.99 | Order to close a position to secure profits. Set in percentages (%). | |
| Type | Minimize Brut, Brut, SHGO, Minimize, Differential | minimize_brut | Selection of the type of optimisation mechanism. |
Backtesting Statistics & Metrics #
| Name | Description |
|---|---|
| Alpha | Alpha is a measure of the performance of an investment portfolio relative to a benchmark. It is the degree to which an investor has managed to “outperform” the market over a period of time. A positive alpha means that the asset has performed better than the benchmark. A neutral alpha indicates a performance similar to the benchmark. A negative alpha reflects a performance below the benchmark. |
| Annual Volatility | Determines the annual volatility of a strategy. |
| Beta | Beta is the measure of past volatility, or risk relative to the wider market. If the coefficient is greater than 1, the asset is more volatile than the market. If the coefficient is less than 1, the asset is less volatile than the reference market. For example, if Beta is equal to 1.2, it means that the asset is 20% more volatile than the market. |
| Calmar | The Calmar ratio is a performance measure used to evaluate commodity trading advisors and hedge funds. Higher the ratio, the better it is. Anything above 0.50 is considered good. A ratio of 3.0 to 5.0 is really good. |
| Kurtosis | Kurtosis is a measure of whether the data are heavy-tailed or light-tailed relative to a normal distribution. That is, data sets with high kurtosis tend to have heavy tails, or outliers. Data sets with low kurtosis tend to have light tails, or lack of outliers. A uniform distribution would be the extreme case. |
| Max Drawdown | Max Drawdown is a risk indicator. It corresponds to the maximum historical loss borne by an investor who would have bought at the highest and sold at the lowest during a given period. |
| Omega | The Omega ratio is a measure of the risk/return performance of an asset, a portfolio or an investment strategy. Omega is an alternative to the Sharpe ratio. A higher ratio indicates that the asset provides more gains than losses for a certain threshold and would therefore be preferred by an investor. |
| Sharpe | The Sharpe ratio compares the return of an investment with its risk. Under 1 is considered bad. 1 is considered acceptable or good. 2 or higher is rated as very good. 3 or higher is considered excellent. |
| Skew | Measure the risk that results when observations are not spread symmetrically around an average value. |
| Sortino | The Sortino ratio is a variation of the Sharpe ratio that differentiates harmful volatility from total overall volatility. Under 1 is considered bad. 1 is considered acceptable or good. 2 or higher is rated as very good. 3 or higher is considered excellent. |
| Stability | Determines the R-squared of a linear fit to the cumulative logarithmic returns. Computes a linear ordinary least squares fit and returns the R-squared. |
| Tail | Determines the ratio between the right (95%) and left tail (5%) of the daily returns distribution. For example, a tail ratio of 0.25 means that losses are four times greater than profits. |
| Value at Risk | VaR is a concept used to measure the market risk of a portfolio. It corresponds to the amount of losses that should only be exceeded with a given probability over a given time horizon. VaR determines the potential for loss and the probability that the defined loss will occur. |
Tutorials #
Find our tutorials here :


